{"cover":"Professional landscape format (1536×1024) hero image with bold text overlay 'Valuing Properties Across England's Divergent Markets: Regional Strategies for Chartered Surveyors in 2026' in extra large 72pt white sans-serif font with dark shadow and semi-transparent navy overlay box, positioned in upper third. Background features split-screen composition showing contrasting English property markets: left side displays modern London skyline with luxury apartments in muted tones suggesting stagnation, right side shows vibrant Northern England terraced housing and new developments with warm lighting suggesting growth. Subtle map of England with regional price indicators overlaid. Color scheme: deep navy blue, gold accents, white text. High contrast, editorial magazine quality, professional surveying aesthetic with measuring tools and property data visualization elements subtly integrated.","content":["Landscape format (1536×1024) detailed infographic showing England's regional property market performance with color-coded map of England displaying different growth rates by region. North East highlighted in vibrant green showing 8.0% rental growth, London in muted red showing 1.1% growth. Bar charts comparing house prices across regions: England £292,000, Wales £215,000, Scotland £191,000. Visual elements include upward and downward arrows, percentage indicators, property icons for different segments (first-time buyer, second-stepper, premium). Clean professional design with data points, grid layout, modern typography, surveyor's measuring tape border detail, editorial quality financial visualization.","Landscape format (1536×1024) professional composition showing chartered surveyor conducting regional property assessment with split-screen approach. Left panel: surveyor with tablet analyzing luxury London property with price sensitivity indicators, inventory charts showing 11-year highs, downward price trend arrows for premium segment (£658,658, -0.2%). Right panel: same surveyor evaluating Northern property with growth indicators, mortgage rate displays showing 4.28% two-year rates, upward momentum arrows. Visual includes comparison tables, regional adjustment factors, valuation methodology frameworks, professional measuring equipment, property blueprints, data overlays. Modern clean aesthetic with navy and gold color scheme, high-quality editorial style.","Landscape format (1536×1024) strategic planning visualization showing surveyor's toolkit for 2026 regional approaches. Central image of professional surveyor at modern desk with multiple screens displaying different regional market data: rental yield comparisons, price growth forecasts (Zoopla 1.5% vs Capital Economics 3.5%), affordability calculations across regions. Visual elements include strategic planning documents, regional market reports, comparative analysis charts, risk assessment matrices, technology integration symbols (AI, data analytics), professional certification badges. Foreground shows hands pointing at regional strategy documents. Background features subtle England map with strategic markers. Clean professional design, editorial quality, navy blue and gold accents, modern business aesthetic."]"}

England's property market has entered an era of unprecedented regional divergence. While Scotland, Northern Ireland, and Northern England experience robust price growth, London and the South East face stagnation—creating a complex landscape that demands sophisticated, region-specific valuation approaches from chartered surveyors. Valuing Properties Across England's Divergent Markets: Regional Strategies for Chartered Surveyors in 2026 requires understanding these stark contrasts and adapting methodologies accordingly.
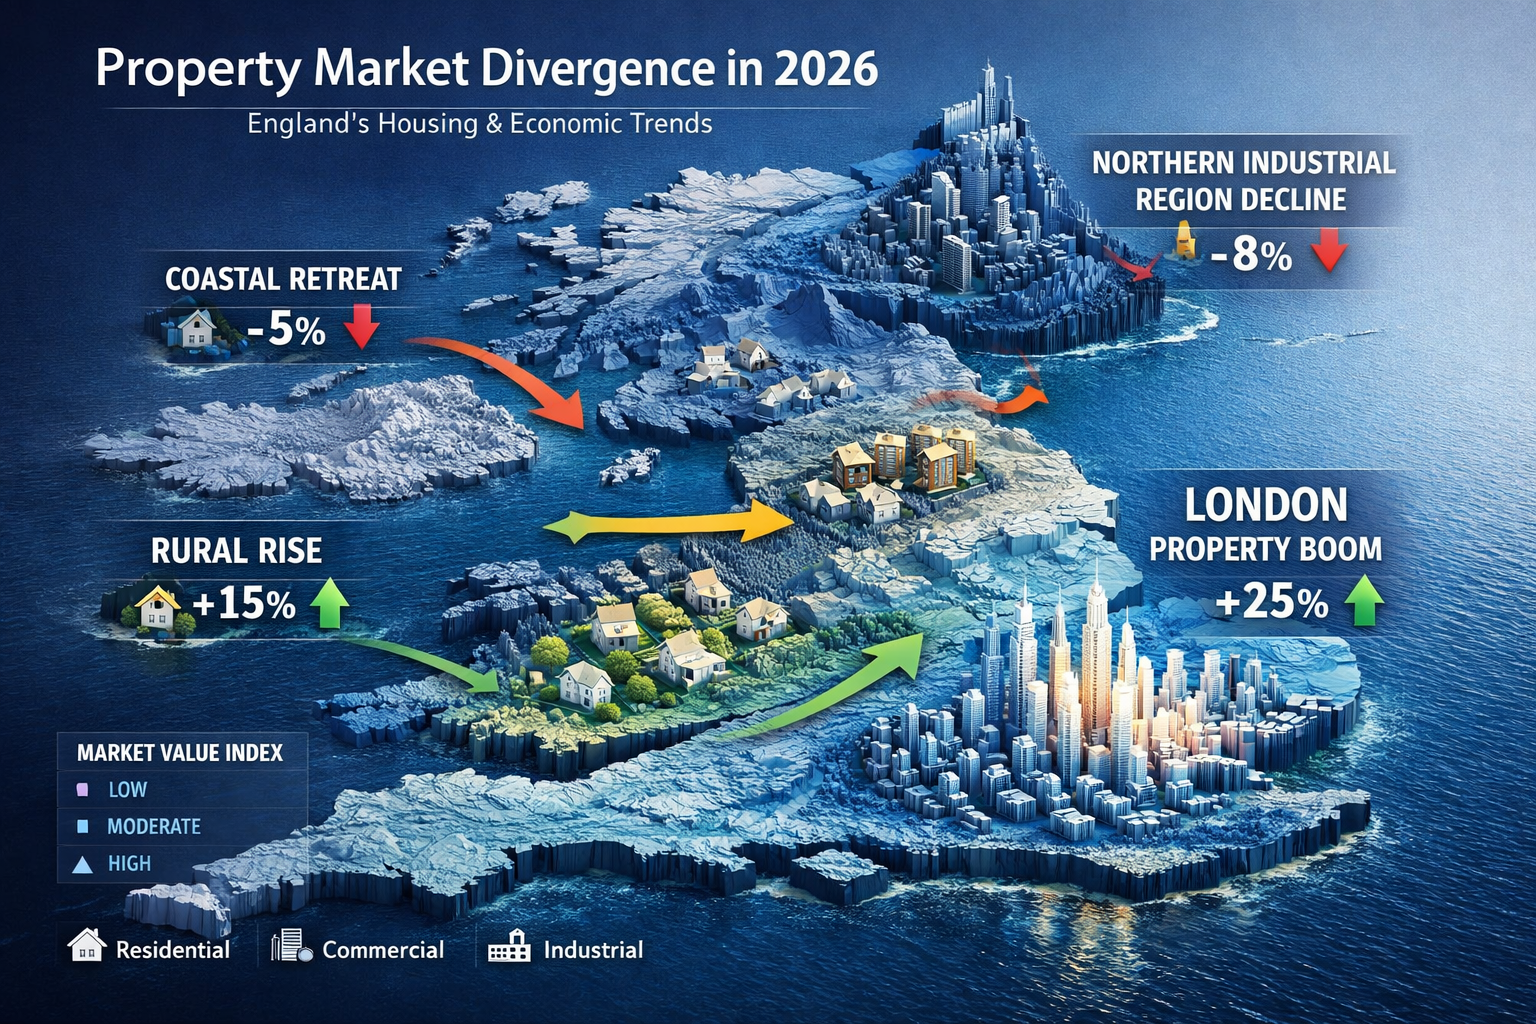
The numbers tell a compelling story: London's private rents showed only 1.1% annual inflation during the 12 months to January 2026, compared with 8.0% in the North East—a sevenfold difference that fundamentally reshapes how surveyors must approach property valuations across different regions[3]. This geographical split extends beyond rental markets, affecting house prices, buyer behavior, and investment potential in ways that challenge traditional valuation frameworks.
Key Takeaways
- 🎯 Regional rent growth varies dramatically: London rental inflation stands at just 1.1% annually while the North East experiences 8.0% growth, requiring surveyors to adopt location-specific valuation adjustments[3]
- 📊 Property segment performance differs significantly: Second-stepper properties show stronger momentum (+0.8% annually) than first-time buyer homes (-0.4%) and premium properties (-0.2%), demanding segment-tailored approaches[1]
- 💷 Inventory levels reached 11-year highs: This stock availability creates regional negotiation advantages that surveyors must factor into market value assessments[1]
- 📈 Mortgage rate stabilization at 4.28% creates varying affordability scenarios across regions based on local property prices, fundamentally altering valuation calculations[1][4]
- 🔮 Growth forecasts range widely: From conservative 1.5% projections to optimistic 3.5% scenarios, requiring surveyors to understand regional nuances when advising clients[4][5]
Understanding England's Regional Property Market Divide in 2026

The property market landscape across England has fractured into distinct regional ecosystems, each operating under different economic pressures and growth trajectories. For chartered surveyors, this fragmentation represents both a challenge and an opportunity to demonstrate specialized expertise.
The North-South Performance Gap
England's average house price stands at £292,000 with modest 1.7% annual growth—a figure that masks dramatic regional variations[3]. This national average conceals the reality that Northern regions are experiencing vigorous growth while Southern markets, particularly London, face headwinds that suppress valuations.
The rental market provides even starker evidence of this divide. Average UK monthly private rents increased 3.5% to £1,367 during the 12 months to January 2026, with England specifically at £1,423[3]. However, this figure disguises the fact that London's rental growth has effectively stalled while Northern regions surge ahead.
For chartered surveyors working across South West London and similar premium markets, this necessitates a fundamental recalibration of valuation assumptions. Traditional methods that relied on consistent year-over-year appreciation no longer apply uniformly across England's geography.
Property Segment Performance Variations
Beyond regional differences, property segments demonstrate divergent performance patterns that complicate valuation work:
| Property Segment | Average Price | Annual Change | Monthly Change |
|---|---|---|---|
| First-Time Buyer (excl. inner London) | £226,050 | -0.4% | +0.2% |
| Second-Stepper | £343,603 | +0.8% | +0.7% |
| Premium/Top of Ladder | £658,658 | -0.2% | -0.2% |
Source: Market data for early 2026[1]
The second-stepper segment shows the strongest momentum, suggesting that mid-market properties offer the most stable valuation environment in 2026. Meanwhile, premium properties face downward pressure—a trend particularly pronounced in traditionally expensive areas like Chelsea and Battersea.
Inventory Dynamics and Price Sensitivity
January 2026 witnessed the largest monthly rise for UK house prices since June 2015, with a remarkable +2.8% increase[1]. However, February held flat at 0.8% below the typical seasonal rise, suggesting consolidation rather than sustained momentum.
This volatility occurs against a backdrop of inventory levels at 11-year highs for this time of year[1]. The abundance of available properties varies regionally and creates distinct negotiation dynamics that surveyors must incorporate into their valuations.
"The market is still very price-sensitive, with sellers adopting cautious pricing strategies in competitive regions where choice is high." — Rightmove Property Expert[1]
For surveyors conducting leasehold extension and enfranchisement valuations, this price sensitivity demands careful consideration of comparable evidence and realistic market positioning.
Regional Valuation Strategies: Tailoring Approaches to Local Market Conditions
Valuing Properties Across England's Divergent Markets: Regional Strategies for Chartered Surveyors in 2026 requires abandoning one-size-fits-all methodologies in favor of nuanced, location-specific approaches that reflect actual market behavior.
Northern England: Growth Market Valuation Techniques
Northern regions present a fundamentally different valuation environment than their Southern counterparts. With rental growth at 8.0% in the North East—seven times London's rate—surveyors must adjust their income capitalization approaches accordingly[3].
Key strategies for Northern markets include:
- Higher yield expectations: Rental growth momentum justifies lower capitalization rates when valuing investment properties
- Affordability advantages: With mortgage rates stabilized at 4.28% for two-year fixes, Northern properties offer superior affordability ratios that support continued demand[1][4]
- Regeneration premiums: Many Northern cities benefit from infrastructure investment and urban renewal that traditional comparables may not fully capture
- First-time buyer focus: The £226,050 average for first-time buyer properties (excluding inner London) aligns well with Northern price points, creating sustained entry-level demand[1]
Surveyors working in these growth markets should weight recent transactions more heavily than historical data, as rapid appreciation can quickly render older comparables obsolete. The momentum in these regions suggests that conservative valuation approaches may actually disserve clients seeking accurate market assessments.
London and South East: Stagnation Market Adjustments
London's rental inflation of just 1.1% annually represents a dramatic reversal from historical norms and signals fundamental market weakness that surveyors cannot ignore[3]. Chartered surveyors in Putney, Clapham, and similar South London locations face particular challenges.
Valuation adjustments for stagnant Southern markets:
- Extended marketing period assumptions: High inventory levels (11-year highs) necessitate longer sale timeline projections[1]
- Downward price pressure recognition: Premium segment properties averaging £658,658 show -0.2% annual and monthly declines that may continue[1]
- Buyer negotiation leverage: Abundant choice empowers buyers to demand concessions that reduce realized sale prices below asking prices
- Rental yield compression: Stagnant rental growth combined with high purchase prices creates unfavorable yield dynamics for investment valuations
For chartered surveyors in East London and similar transitional markets, the challenge involves identifying micro-markets within broader regions that may outperform—requiring granular local knowledge beyond standard valuation databases.
Home Counties and Commuter Belt: Hybrid Approaches
Markets in areas like Guildford, Godalming, Hemel Hempstead and Harpenden, and Twickenham occupy a middle ground—neither experiencing Northern growth nor Southern stagnation.
These commuter markets require hybrid valuation strategies that balance:
- London employment connectivity: Properties with superior transport links command premiums that justify separate valuation brackets
- Local amenity assessment: School quality, green space access, and community infrastructure create value differentials within small geographic areas
- Remote work impact: Post-pandemic working patterns continue reshaping demand, with home office space becoming a material valuation factor
- Second-stepper segment strength: The £343,603 average with +0.8% annual growth aligns well with commuter belt price points, suggesting relative stability[1]
Surveyors in these markets benefit from understanding both London market dynamics (which drive demand) and local supply constraints (which support pricing), creating a more complex but potentially more stable valuation environment.
Regional Markets Beyond Traditional Hotspots
Areas like Harrow, Ilford, Sussex, and South East London each present unique characteristics that defy simple categorization.
Effective valuation in these diverse markets requires:
✅ Hyperlocal comparable selection: Drawing comparables from within 0.5-mile radius rather than broader geographic areas
✅ Transport infrastructure weighting: Proximity to rail, Underground, or major road networks creates measurable value differentials
✅ Demographic trend analysis: Understanding population shifts, age profiles, and household composition changes that drive local demand
✅ Development pipeline awareness: Planned infrastructure, housing developments, and commercial projects that will impact future values
✅ Regulatory environment consideration: Local planning policies, conservation areas, and development restrictions that constrain or enable value growth
Practical Implementation: Tools and Techniques for Regional Valuation Excellence
Successfully implementing Valuing Properties Across England's Divergent Markets: Regional Strategies for Chartered Surveyors in 2026 requires both conceptual understanding and practical execution capabilities.
Data Sources and Market Intelligence
Modern property valuation demands access to granular, current market data that reflects rapid regional divergence. Surveyors should leverage:
Primary data sources:
- Land Registry transaction data with regional filtering capabilities
- Rental market indices broken down to postcode district level
- Mortgage approval statistics by region and property type
- Local authority planning and development databases
- Estate agent marketing data showing time-on-market trends
Supplementary intelligence:
- Regional economic indicators (employment, wage growth, business formation)
- Infrastructure investment announcements and timelines
- Demographic projections at local authority level
- School performance data and catchment area boundaries
- Environmental factors (flood risk, air quality, green space access)
The divergence between London's 1.1% rental inflation and the North East's 8.0% growth demonstrates why national-level data provides insufficient granularity for accurate regional valuations[3].
Valuation Methodology Adjustments
Traditional valuation approaches require modification to address regional market variations:
Comparative method refinements:
- Geographic radius adjustment: Tighten comparable search radius in diverse markets; expand in homogeneous areas
- Time weighting: Apply greater weight to recent transactions in rapidly changing markets (Northern growth areas); extend time horizon in stable markets
- Adjustment factor calibration: Develop region-specific adjustment percentages for property characteristics based on local buyer preferences
Income approach modifications:
- Regional yield curves: Establish distinct capitalization rate ranges for different regions reflecting growth expectations
- Rental growth projections: Apply region-specific rental inflation forecasts rather than national averages (critical given 1.1% vs 8.0% divergence)[3]
- Void period assumptions: Adjust expected vacancy rates based on regional supply-demand balance and inventory levels
Residual method considerations:
- Development cost variations: Construction costs vary regionally, affecting residual land values
- Sales rate assumptions: Absorption rates differ dramatically between high-demand Northern markets and oversupplied Southern areas
- Planning risk assessment: Local authority approval rates and timelines vary, impacting development viability
Technology Integration for Regional Analysis
Advanced surveyors increasingly leverage technology to enhance regional valuation accuracy:
🔧 Geographic Information Systems (GIS): Mapping tools that visualize price gradients, transport accessibility, and amenity proximity
🔧 Automated Valuation Models (AVMs): Machine learning algorithms trained on regional data sets, used as cross-checks rather than primary valuations
🔧 Market analytics platforms: Subscription services providing real-time regional market statistics and trend analysis
🔧 Comparable evidence databases: Searchable repositories with advanced filtering for property characteristics and location parameters
However, technology complements rather than replaces professional judgment. The 11-year high inventory levels and price sensitivity that characterize 2026 markets require nuanced interpretation that algorithms alone cannot provide[1].
Client Communication and Expectation Management
Regional market divergence creates communication challenges when clients hold outdated assumptions about property values. Effective surveyors:
Educate clients on regional dynamics:
- Present comparative regional data showing growth rate variations
- Explain how London's 1.1% rental inflation versus Northern growth impacts investment returns[3]
- Contextualize property segment performance (first-time buyer vs. second-stepper vs. premium)[1]
Set realistic expectations:
- Reference conservative 1.5% growth forecasts alongside optimistic 3.5% scenarios, explaining regional applicability[4][5]
- Discuss inventory levels and their impact on negotiation leverage
- Explain mortgage rate stabilization effects on affordability across different price points[1][4]
Provide actionable insights:
- Identify specific regional opportunities aligned with client objectives
- Recommend optimal timing strategies based on regional market cycles
- Suggest portfolio diversification approaches that balance high-growth and stable markets
This consultative approach positions surveyors as strategic advisors rather than mere data providers—a distinction that becomes increasingly valuable as markets grow more complex.
Professional Development and Regional Expertise
The specialized knowledge required for Valuing Properties Across England's Divergent Markets: Regional Strategies for Chartered Surveyors in 2026 demands ongoing professional development:
Essential competencies:
- Regional economic analysis capabilities
- Statistical interpretation skills for market trend identification
- Technology proficiency for data analysis and visualization
- Communication abilities for complex concept explanation
- Ethical judgment for managing conflicts between regional market realities and client expectations
Surveyors should consider participating in professional development events focused on regional market analysis and engaging with early career programs that emphasize contemporary valuation challenges.
Risk Management in Divergent Markets
Regional market divergence introduces valuation risks that require careful management:
⚠️ Over-reliance on historical patterns: Past performance provides limited guidance when regions experience unprecedented divergence
⚠️ Inadequate comparable adjustment: Failing to properly adjust for regional differences can produce materially inaccurate valuations
⚠️ Timing sensitivity: The January 2026 spike (+2.8%) followed by February flattening demonstrates how rapidly conditions can shift[1]
⚠️ Forecast uncertainty: The wide range between conservative 1.5% and optimistic 3.5% growth projections reflects genuine uncertainty[4][5]
Mitigation strategies include:
- Providing valuation ranges rather than point estimates when appropriate
- Clearly documenting assumptions and their regional basis
- Conducting sensitivity analysis showing valuation impacts of different regional scenarios
- Maintaining professional indemnity insurance adequate for regional practice scope
- Following The Prince Chartered Surveyors Way or similar professional frameworks that emphasize quality and consistency
Conclusion: Navigating England's Regional Property Landscape Successfully
Valuing Properties Across England's Divergent Markets: Regional Strategies for Chartered Surveyors in 2026 represents both a professional challenge and an opportunity for differentiation. The sevenfold difference between London's 1.1% rental inflation and the North East's 8.0% growth exemplifies a market fragmentation that demands sophisticated, region-specific approaches[3].
Chartered surveyors who develop genuine regional expertise—understanding not just price variations but the underlying economic, demographic, and infrastructure factors driving them—position themselves as indispensable advisors in an increasingly complex property landscape. The divergence between first-time buyer properties (-0.4% annually), second-stepper homes (+0.8%), and premium properties (-0.2%) further underscores the need for nuanced, segment-specific analysis[1].
Actionable Next Steps for Chartered Surveyors
📋 Conduct a regional capability audit: Assess current knowledge across England's diverse markets and identify gaps requiring development
📋 Develop regional data infrastructure: Establish systematic processes for collecting, analyzing, and updating region-specific market intelligence
📋 Refine valuation methodologies: Adapt comparative, income, and residual approaches to reflect regional market characteristics
📋 Invest in technology tools: Implement GIS, analytics platforms, and databases that enhance regional analysis capabilities
📋 Build regional networks: Establish relationships with local estate agents, developers, and other market participants who provide on-the-ground intelligence
📋 Enhance client communication: Develop presentation materials and frameworks that effectively explain regional market dynamics to diverse client audiences
📋 Pursue continuing education: Engage with professional development opportunities focused on regional economic analysis and contemporary valuation challenges
The property market of 2026 rewards specialists who understand regional nuances over generalists applying uniform approaches. With mortgage rates stabilized at 4.28% creating varying affordability scenarios across regions, and inventory at 11-year highs reshaping negotiation dynamics, the surveyors who master regional strategies will deliver superior value to clients while building sustainable competitive advantages[1][4].
Whether working in high-growth Northern markets, stagnant Southern areas, or the complex middle ground of commuter belts and transitional neighborhoods, success requires abandoning outdated assumptions and embracing the reality of England's divergent property markets. The data is clear, the trends are established, and the opportunity for those willing to adapt is substantial.
References
[1] Uk House Prices Hold Steady In February After Bumper Start To 2026 – https://www.morningstar.com/news/alliance-news/1771200097476297000/uk-house-prices-hold-steady-in-february-after-bumper-start-to-2026
[2] 197 February – https://www.fraser-reeves.co.uk/blog/197-february-
[3] February2026 – https://www.ons.gov.uk/economy/inflationandpriceindices/bulletins/privaterentandhousepricesuk/february2026
[4] House Prices – https://moneyweek.com/investments/house-prices/house-prices
[5] Uk Housing Market Chart Pack Feb 2026 – https://www.capitaleconomics.com/publications/uk-housing-market-chart-pack/uk-housing-market-chart-pack-feb-2026