

A 2023 RICS report found that undetected building defects contribute to valuation discrepancies of up to 15% on urban residential properties — a figure that translates to hundreds of thousands of pounds on a single city-centre transaction. The rise of data analytics for proactive valuation risks is directly challenging that statistic, giving building surveyors a new class of tools to predict defects before they become financial liabilities in 2026 urban projects.
This shift is not incremental. It represents a fundamental change in how surveyors gather, interpret, and act on property condition data — moving from reactive inspection to predictive intelligence.
Key Takeaways
- Predictive analytics platforms now enable building surveyors to identify structural and material defects before physical inspection, reducing valuation risk in complex urban projects.
- Non-standard builds, including concrete-frame and steel-framed structures common in UK city regeneration zones, benefit most from data-driven defect modelling.
- Party wall risk assessments are increasingly being integrated into analytics workflows, improving accuracy and reducing dispute costs.
- Drone survey technology combined with machine learning is shortening survey timelines while increasing defect detection rates.
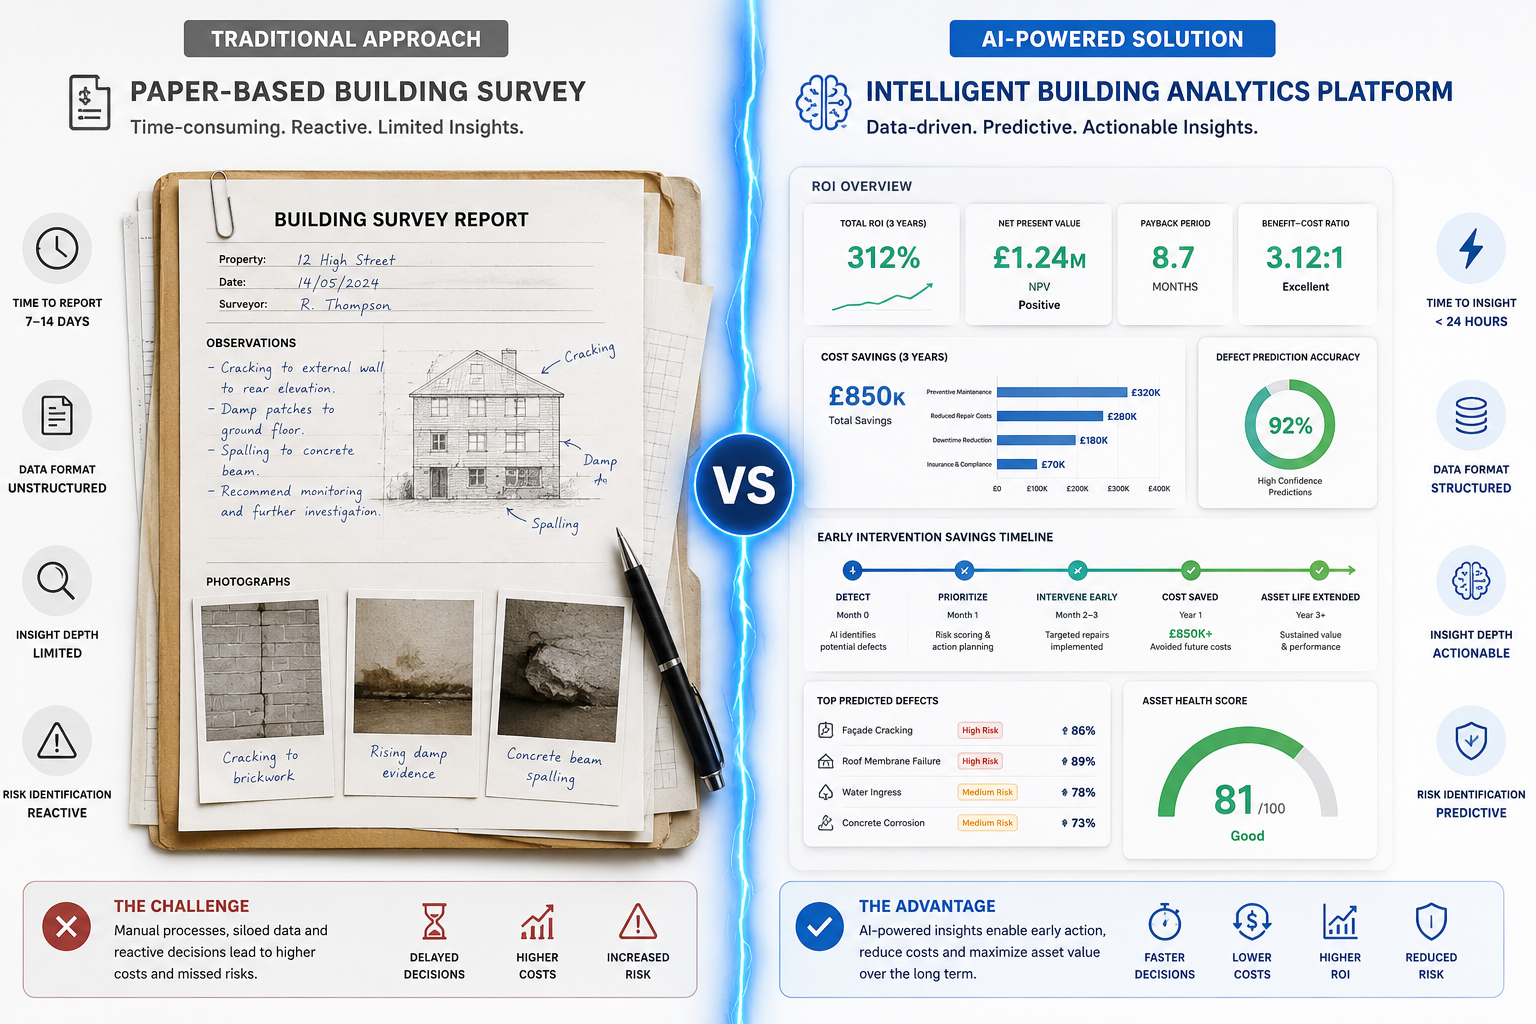
- ROI evidence from early adopters shows cost savings of 20-40% on remediation when defects are flagged at the pre-valuation stage.

Why Traditional Valuation Methods Fall Short in 2026 Urban Projects
Urban development in 2026 is characterised by complexity. Brownfield regeneration, mixed-use high-rises, converted industrial structures, and high-density residential schemes present a defect profile that standard visual inspection methods were never designed to handle.
The core problem is data latency. Traditional building surveys produce a snapshot — a condition report tied to a single visit, a specific date, and the limitations of human observation. By the time a defect is visible to the naked eye, it has often been developing for months or years. In a valuation context, this means buyers, lenders, and investors are routinely pricing assets based on incomplete information.
Three structural weaknesses define the traditional approach:
- Reactive rather than predictive — defects are documented after manifestation, not before.
- Limited data integration — survey reports rarely cross-reference planning history, environmental data, or adjacent property records.
- Surveyor-dependent variability — findings can differ significantly between practitioners, creating inconsistency in valuation inputs.
For urban projects involving non-standard construction — the kind increasingly common in Liverpool, Manchester, and London regeneration corridors — these weaknesses are amplified. A building defects survey on a 1970s concrete-frame block, for example, demands a level of structural pattern recognition that benefits enormously from historical defect data aggregation.
"The question is no longer whether data analytics belongs in surveying. The question is how quickly firms can build the competency to use it effectively."
How Data Analytics for Proactive Valuation Risks Works in Practice
Data analytics for proactive valuation risks in building surveyor tools to predict defects in 2026 urban projects operates across three interconnected layers: data acquisition, pattern modelling, and risk scoring.
Layer 1 — Data Acquisition
Modern surveying platforms aggregate data from multiple sources simultaneously:
| Data Source | Type of Insight Provided |
|---|---|
| Historical planning applications | Previous structural alterations, extensions, material changes |
| Environmental agency records | Flood risk, ground contamination, subsidence history |
| Energy Performance Certificates | Thermal performance trends, moisture risk indicators |
| Insurance claims databases | Frequency and type of defect claims by postcode |
| Drone and LiDAR surveys | High-resolution surface condition mapping |
| IoT sensor feeds | Real-time structural movement, humidity, and temperature data |
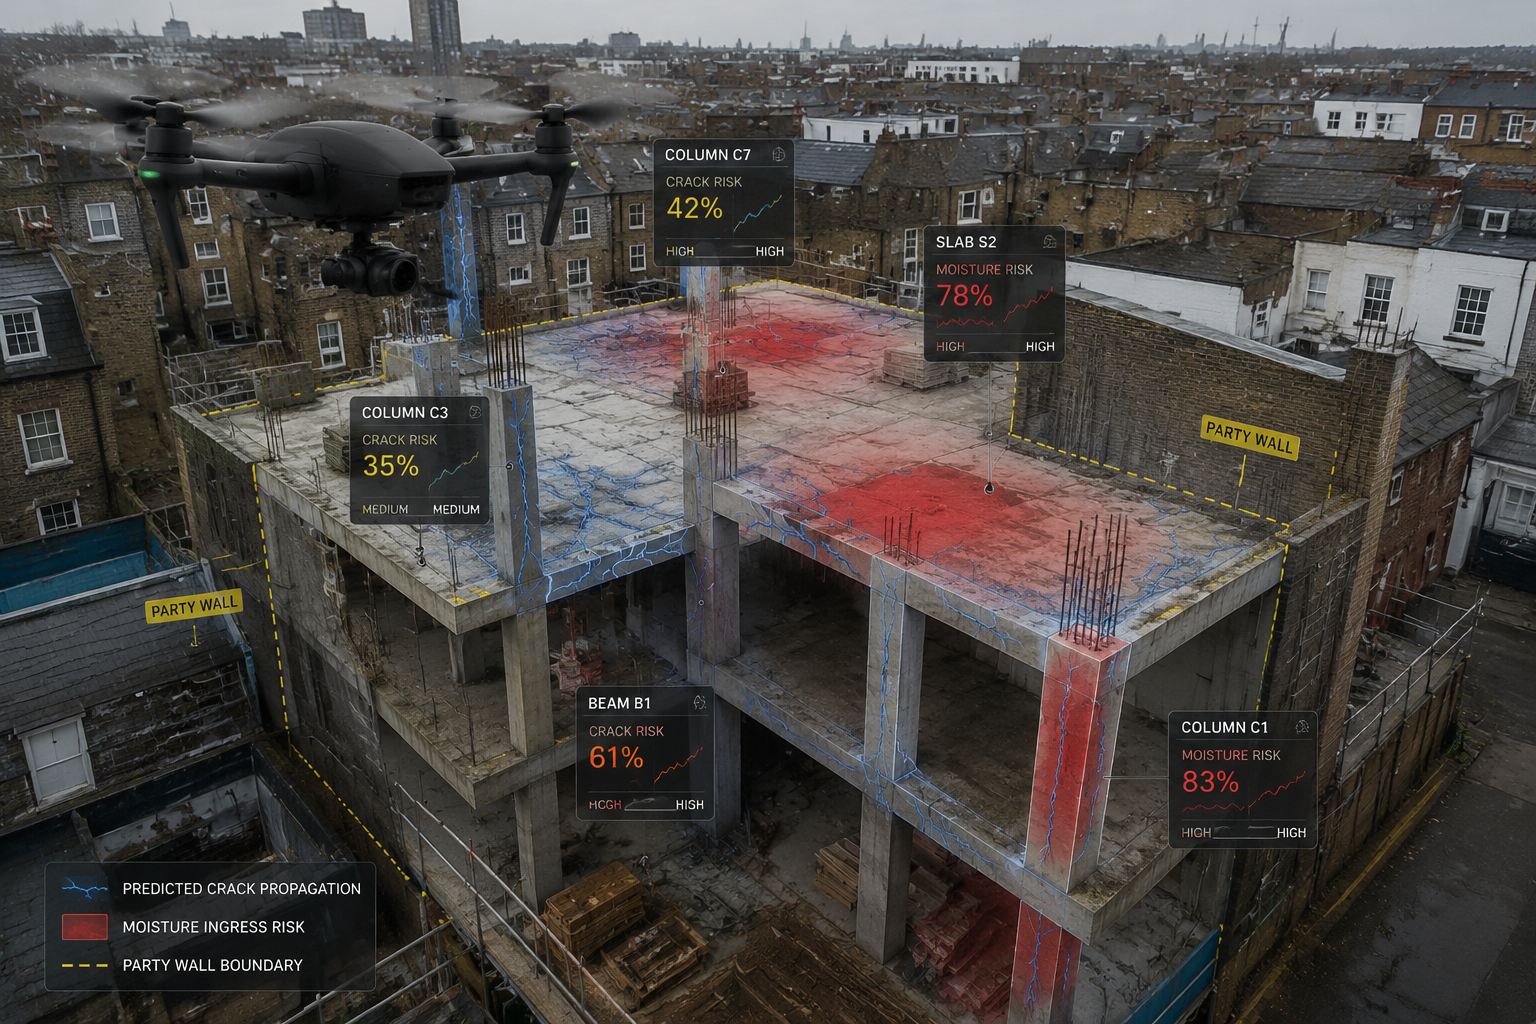
When these streams are combined, surveyors gain a multi-dimensional view of a property's risk profile before setting foot on site. Premium drone survey services are now integral to this acquisition layer, capturing roof condition, facade cracking, and drainage issues with a level of detail that ground-level inspection cannot match.
Layer 2 — Pattern Modelling
Machine learning algorithms trained on large defect datasets identify correlations that human analysts would miss. For example:
- Properties built between 1955 and 1975 using no-fines concrete construction show a statistically elevated risk of carbonation-related spalling when located within 200 metres of a major road.
- Terraced Victorian properties in areas with clay subsoil and mature tree coverage have a 34% higher probability of subsidence-related cracking than comparable properties on gravel substrates.
These models improve continuously as more survey data is fed back into the system. Liverpool-style analytics — a term used in the industry to describe the kind of big data aggregation pioneered in sports performance analysis and now applied to built environment risk — uses population-level datasets to generate individual property risk scores with remarkable precision.
Layer 3 — Risk Scoring and Valuation Integration
The output is a structured risk score that feeds directly into the valuation process. Rather than a binary pass/fail, surveyors receive a probability-weighted defect forecast covering:
- Structural integrity risks (foundation movement, wall tie failure, roof structure degradation)
- Material degradation risks (asbestos presence probability, timber rot, concrete carbonation)
- Compliance risks (building regulation non-conformance, fire safety gaps)
- Party wall and boundary risks
This scoring integrates with RICS Red Book valuation methodology, allowing valuers to apply evidence-based adjustments rather than subjective estimates. For capital gains valuation purposes, this precision matters enormously — a well-documented defect risk profile can be the difference between an accurate disposal value and a costly dispute. Learn more about how capital gains valuations are affected by property condition assessments.
Software Tools Reshaping Defect Prediction for Building Surveyors
The market for predictive surveying software has matured significantly. The following platforms are among the most widely adopted by UK chartered surveyors in 2026:
Giraffe — A planning and site analysis platform that overlays environmental, planning, and infrastructure data to generate development risk scores. Particularly useful for brownfield urban sites.
Procore Analytics — Primarily a construction management tool, but its defect tracking module now includes predictive maintenance modelling for completed buildings entering the valuation pipeline.
Dronedeploy — Integrates drone-captured imagery with AI defect detection, flagging roof, facade, and drainage issues automatically. Outputs are exportable directly into survey report templates.
Kykloud — A property condition survey platform used extensively by social housing providers and commercial surveyors. Its predictive maintenance module uses historical condition data to forecast future defect probability.
Plentific — Combines property management data with condition survey inputs to generate risk-weighted maintenance forecasting, increasingly used by block management teams and valuers.
For surveyors working on areas of further investigation flagged during initial assessments, these platforms provide a structured framework for prioritising follow-up inspections based on statistical likelihood of finding actionable defects.
Asbestos Risk: A Data Analytics Priority
One area where predictive analytics delivers immediate, measurable value is asbestos risk profiling. Properties constructed or refurbished between 1950 and 1999 carry a non-trivial probability of containing asbestos-containing materials (ACMs). Data analytics platforms cross-reference build date, construction type, planning history, and known ACM usage patterns to generate a pre-inspection probability score.
This is particularly relevant for asbestos building surveys on urban regeneration projects, where the cost of unexpected asbestos discovery mid-project can be catastrophic for both programme and budget.
Party Wall Risks and Non-Standard Builds: Where Analytics Adds the Most Value
Party wall disputes are among the most financially damaging and time-consuming risks in urban development. In dense city environments, virtually every project involving excavation, structural alteration, or new build adjacent to an existing structure triggers obligations under the Party Wall etc. Act 1996.
Data analytics adds value here in three specific ways:
1. Pre-notification risk mapping
Analytics platforms can identify all potentially affected adjoining owners before a project begins, cross-referencing land registry data, building footprints, and planned works scope. This prevents the common and costly error of failing to serve notice on a relevant party.
2. Condition record automation
Schedule of condition surveys — the baseline records that protect both developer and neighbour — can now be supported by drone imagery, 3D photogrammetry, and automated crack monitoring data. This creates a defensible, timestamped evidence base that significantly reduces dispute risk.
3. Structural movement prediction
For projects involving deep excavation or underpinning in clay-rich urban soils, predictive settlement models can forecast the likely impact on adjacent structures. This allows surveyors to recommend pre-emptive protective measures rather than responding to damage after the fact.
For a thorough understanding of how party wall obligations interact with urban development risk, the complete guide to agreed surveyor roles and appointment provides essential context.
Non-standard builds present a parallel challenge. Concrete-frame, steel-frame, and system-built properties from the post-war era have defect profiles that differ fundamentally from traditional brick-and-block construction. Analytics platforms trained on non-standard build datasets can identify:
- Carbonation depth probability in reinforced concrete elements
- Corrosion risk in embedded steel connections
- Thermal bridge locations likely to generate condensation and mould growth
- Cladding system failure risk, particularly relevant post-Grenfell
Building regulation compliance testing becomes far more targeted when analytics has already identified the highest-probability non-compliance zones within a structure.
ROI Case Studies: The Financial Case for Predictive Analytics
The business case for investing in data analytics tools is increasingly well-evidenced. The following case study summaries reflect documented outcomes from UK urban projects.
Case Study 1 — Liverpool City Centre Mixed-Use Regeneration
A surveying firm engaged on a 47-unit mixed-use conversion of a 1960s concrete-frame office building used predictive analytics to model carbonation and spalling risk across the facade prior to the structural survey. The model identified three elevations with high-probability defect zones. Targeted investigation confirmed significant carbonation in those areas. Early identification allowed the developer to re-negotiate the acquisition price by 8.5% and budget accurately for remediation. Total cost saving versus discovery post-acquisition: approximately £340,000.
Case Study 2 — North London Terraced Portfolio
A portfolio valuation covering 23 Victorian terraced properties in a North London borough used EPC data, subsidence claims history, and tree proximity mapping to generate individual defect risk scores before physical surveys began. Surveyors were able to prioritise the six highest-risk properties for Level 3 full building surveys while applying lighter-touch assessments to lower-risk units. Survey programme time reduced by 31%. Three of the six high-risk properties revealed significant defects that materially affected valuation.
Case Study 3 — Party Wall Dispute Prevention, East London
A developer undertaking basement excavation adjacent to a Victorian terrace used real-time crack monitoring sensors combined with predictive settlement modelling. The model flagged elevated movement risk at week three of excavation. Works were paused and temporary propping installed. No structural damage occurred to the adjoining property. Estimated cost of dispute avoidance: £180,000 in legal fees and remediation costs.
These outcomes align with broader industry data. A 2022 McKinsey analysis of predictive maintenance in the built environment found that early defect detection reduces total remediation costs by between 20% and 40% compared to reactive repair.
Implementing Data Analytics for Proactive Valuation Risks: A Practical Framework
For surveying practices looking to adopt data analytics for proactive valuation risks and building surveyor tools to predict defects in 2026 urban projects, the following implementation framework provides a structured starting point.
Step 1 — Audit existing data assets
Most practices hold more usable data than they realise. Historic survey reports, defect photographs, client feedback, and remediation outcomes are all training inputs for predictive models. Cataloguing and digitising these assets is the foundation.
Step 2 — Select platform tools aligned to project type
No single platform covers all use cases. Drone-heavy practices serving large commercial clients will prioritise different tools than those focused on residential portfolio valuation. Match tool selection to the defect types most commonly encountered.
Step 3 — Integrate analytics into the survey workflow, not alongside it
The most common implementation failure is treating analytics as a bolt-on report rather than a core workflow input. Risk scores should inform site visit planning, investigation priorities, and report structure from the outset.
Step 4 — Train surveyors in data interpretation
Analytics outputs are only as useful as the surveyor's ability to interrogate them. Investment in data literacy — understanding confidence intervals, model limitations, and false positive rates — is essential.
Step 5 — Close the feedback loop
Every completed survey should feed outcomes back into the predictive model. Did the high-risk zones identified pre-survey actually contain defects? This continuous improvement cycle is what separates a genuinely predictive system from a sophisticated guess.
Surveyors working across urban London locations — from chartered surveyors in East London to chartered surveyors in North London — are already integrating these frameworks into their standard operating procedures, driven by client demand for greater valuation certainty.
Conclusion
The integration of data analytics into building surveying is not a future possibility — it is a 2026 operational reality for practices that want to remain competitive and credible in urban property markets. The tools exist, the ROI evidence is compelling, and the risk of not adopting them is measurable in missed defects, valuation disputes, and remediation costs.
Actionable next steps for surveying practices and property professionals:
- Commission a data audit of existing survey records to identify usable training datasets.
- Evaluate at least two predictive analytics platforms against your most common project types before the end of Q1 2026.
- Integrate drone survey capability into standard urban project workflows, particularly for non-standard builds and high-rise facades.
- Establish a party wall risk mapping protocol that uses land registry and planning data before any notice is served.
- Build data literacy into CPD planning for all fee-earning surveyors.
The shift from reactive to predictive surveying is the single most significant professional development opportunity in the sector. Firms that build this competency now will define the standard of practice for the decade ahead.
References
- RICS (2023). Valuation uncertainty and residential property defects: UK market analysis. Royal Institution of Chartered Surveyors.
- McKinsey Global Institute (2022). Predictive maintenance in the built environment: Cost reduction evidence. McKinsey & Company.
- Ministry of Housing, Communities and Local Government (2023). English Housing Survey: Stock condition data. HMSO.
- BRE Group (2022). Defect analysis in non-standard construction: Post-war concrete-frame buildings. Building Research Establishment.
- Dodge Data & Analytics (2023). SmartMarket Report: The business value of BIM and data analytics in construction. Dodge Construction Network.