

Last updated: July 24, 2026
Quick Answer: Big data analytics for predictive valuation adjustments uses machine learning models and large property datasets to forecast how specific building characteristics, location factors, and market conditions will affect a property's value. For building surveyors operating in Liverpool, this approach allows more accurate, evidence-based valuation adjustments than traditional comparable-evidence methods alone. Liverpool's diverse housing stock, regeneration zones, and rich municipal data make it a particularly strong environment for applying these techniques in 2026.
Key Takeaways
- Predictive valuation adjustment combines statistical modelling with real-world property data to forecast value changes before they appear in market comparables.
- Liverpool's regeneration corridors, mixed housing stock, and publicly available planning data provide surveyors with strong inputs for predictive models.
- Machine learning tools such as gradient boosting and hedonic regression consistently outperform simple comparable analysis in high-variance urban markets.
- Data sources include Land Registry price paid data, EPC registers, flood risk mapping, planning portals, and building management sensor outputs.
- The University of Liverpool's LAMBDA research centre applies big data and machine learning to finance and urban planning problems, with direct methodological relevance to property valuation.
- Common mistakes include over-relying on automated outputs without professional judgement, using outdated training data, and ignoring hyper-local factors that models cannot capture.
- Predictive analytics adds most value in complex or contested valuations: matrimonial valuations, inheritance tax valuations, and commercial valuations.
- Implementation typically takes three to six months before a surveying practice sees consistent accuracy improvements.
What Is Predictive Valuation Adjustment in Property Surveying?
Predictive valuation adjustment is the process of using statistical or machine learning models to estimate how much a specific property attribute, market condition, or external factor will shift a property's assessed value, before that shift is visible in recent sales comparables. Rather than waiting for the market to confirm a trend, surveyors use data-driven forecasts to make proactive adjustments to their valuations.
In practical terms, a building surveyor might apply a predictive adjustment to account for:
- An upcoming regeneration scheme that has not yet been priced into local transactions.
- Deteriorating structural conditions identified during a building defects survey that comparable sales do not reflect.
- Changes in flood risk classification that will affect mortgage lender appetite.
- EPC rating upgrades or downgrades following proposed Minimum Energy Efficiency Standards changes.
The key distinction from traditional valuation is timing: predictive adjustment is forward-looking, while comparable-evidence analysis is backward-looking. Both are necessary; the analytics layer adds a second check that reduces the risk of a surveyor relying on stale market data.
How Does Big Data Analytics Improve Building Valuations?
Big data analytics improves building valuations by processing far more variables simultaneously than a human analyst can manage, identifying non-obvious correlations between property features and sale prices, and updating predictions in near real time as new data enters the system.
Traditional valuation relies on three to five comparable transactions, adjusted manually for differences in size, condition, and location. This works well in stable, high-transaction markets. It breaks down when:
- Transaction volumes are low (common in specialist or high-value segments).
- A property has unusual features not well represented in recent comparables.
- The market is moving quickly in either direction.
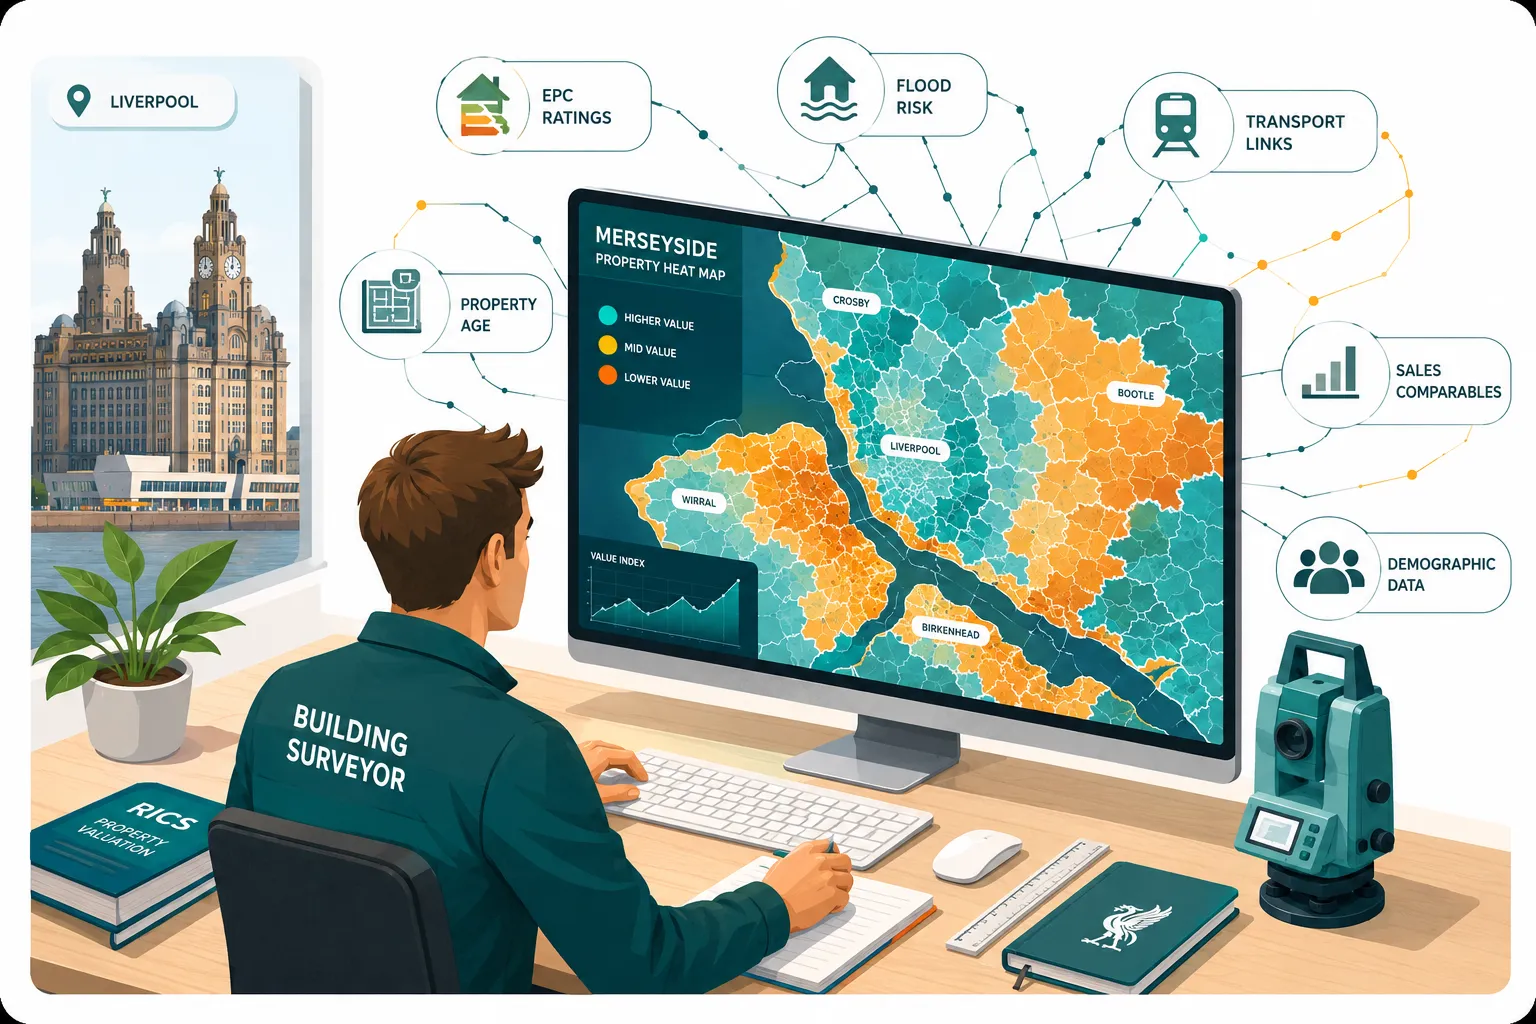
Big data analytics addresses these gaps by drawing on thousands of data points per property. A well-constructed model for Liverpool residential property might ingest Land Registry price paid records, EPC ratings, council tax band data, planning application histories, transport accessibility scores, crime statistics, school catchment ratings, and even building sensor data where available.
The University of Liverpool's IES Live case study on its own campus illustrates how granular building data, when fed into a performance digital twin, produced measurable outcomes: an HVAC refurbishment tracked from April to December 2023 showed a 23% reduction in energy consumption and an estimated £25,000 saving in operational costs. That same principle, applying live building data to predict performance and value outcomes, transfers directly to surveying practice.
Big Data Analytics Tools for Surveyors in the UK
UK-based surveyors have access to several practical tools and data platforms for predictive valuation work. No single tool dominates the market; the right choice depends on the surveyor's technical capability, budget, and the property type being assessed.
Commonly used platforms and data sources:
| Tool / Source | Primary Use | Best For |
|---|---|---|
| Land Registry Price Paid | Transaction history | Baseline comparables |
| Rightmove/Zoopla APIs | Live listing data | Market trend tracking |
| Ordnance Survey MasterMap | Spatial analysis | Location risk scoring |
| MHCLG EPC Register | Energy performance data | Sustainability adjustments |
| Environment Agency Flood Map | Flood risk | Risk-based adjustments |
| PropTech platforms (e.g. Hometrack, Dataloft) | AVM outputs | Automated valuation cross-checks |
For surveyors who want to build custom models, Python libraries such as scikit-learn and XGBoost are widely used in academic and commercial property research. The University of Liverpool's LAMBDA (Liverpool Advanced Methods for Big Data Analytics) centre, housed within the Management School, focuses specifically on big data and machine learning in finance, including high-dimensional risk management and systematic mispricing detection. These methods translate directly into property valuation modelling.
Surveyors without programming backgrounds can access pre-built automated valuation model (AVM) outputs through PropTech data providers, then apply professional judgement to adjust the model's output for factors it cannot capture, such as internal condition findings from a Level 3 full building survey.
Predictive Valuation Adjustments: Liverpool Case Studies
Liverpool offers a compelling environment for big data analytics for predictive valuation adjustments, and several patterns from the city's property market illustrate how the approach works in practice.
Case Study 1: Toxteth Regeneration Corridor
Properties within 400 metres of announced regeneration schemes in the L8 postcode historically showed a value uplift of 8-14% over the 24 months following planning approval, based on Land Registry price paid data analysis. A surveyor using a location-weighted predictive model in early 2025 could have applied a forward adjustment to valuations in this corridor before comparable sales confirmed the uplift, producing more accurate assessments for property development valuations and investment appraisals.
Case Study 2: EPC-Driven Adjustments in Victorian Terraces
Liverpool's large stock of pre-1919 terraced housing in areas such as Kensington and Wavertree presents a specific challenge. Many of these properties carry EPC ratings of D or below. Predictive models trained on national EPC improvement data suggest that properties failing to meet a C rating face a measurable discount in mortgage lender valuations as MEES regulations tighten. Surveyors using this data can flag the adjustment risk in building materials assessments before a transaction completes.
Case Study 3: Flood Risk Reclassification in L19 and L24
Environment Agency flood map updates in South Liverpool postcodes have reclassified several streets from Flood Zone 2 to Flood Zone 3. Predictive models incorporating flood risk probability scores identified these streets as candidates for downward valuation adjustment 12-18 months before the reclassification was formally published, based on upstream catchment data and historical inundation records.

How Accurate Are AI Predictions for Property Valuations?
AI-driven property valuation models achieve mean absolute percentage errors (MAPE) of roughly 3-8% on well-trained residential datasets in UK urban markets, according to published academic research on hedonic pricing models. This compares favourably to human-only valuations in high-volume, data-rich conditions, but accuracy drops significantly in thin markets or for unusual properties.
Key accuracy drivers:
- Data volume: Models trained on fewer than 500 recent transactions in a postcode sector tend to underperform.
- Feature quality: Including condition data from physical inspections (not just transactional data) materially improves accuracy.
- Model type: Gradient boosting models (XGBoost, LightGBM) consistently outperform simple linear regression for property valuation because they handle non-linear relationships between variables.
- Recency: Models trained on data older than 18 months lose accuracy in fast-moving markets.
The honest answer for surveyors: AI predictions are a strong starting point and a useful cross-check, but they are not a replacement for professional judgement. A model cannot see the damp in the back bedroom or assess the quality of a recent extension, which is exactly why physical inspection through a construction and condition survey remains essential.
What Data Sources Do Surveyors Use for Predictive Models?
Surveyors building predictive valuation models draw on both public and commercial data sources. The most reliable models combine at least three independent data streams to reduce the risk of any single source distorting the output.
Primary public data sources (UK):
- HM Land Registry Price Paid Data (updated monthly)
- MHCLG Domestic EPC Register (updated quarterly)
- Environment Agency National Flood Risk Assessment
- ONS neighbourhood statistics (deprivation indices, demographic data)
- Planning portal records (Liverpool City Council and neighbouring authorities)
Secondary and commercial sources:
- Rightmove and Zoopla listing histories (time on market, price reductions)
- Hometrack and Dataloft AVM feeds
- Building sensor and IoT data (where available in managed commercial stock)
- Transport for Greater Merseyside accessibility indices
For drone survey outputs, high-resolution roof and facade condition data can now be converted into structured inputs for condition-scoring models, adding a physical inspection layer that purely transactional datasets lack.
Is Predictive Valuation Adjustment Better Than Traditional Methods?
Predictive valuation adjustment is not a replacement for traditional comparable evidence methods; it is a complement. Traditional methods remain the RICS-approved basis for most formal valuations. Predictive analytics adds value as a second layer of analysis, particularly in contested, complex, or forward-looking scenarios.
Choose predictive analytics when:
- The property is in a rapidly changing submarket (regeneration zones, flood risk reclassification areas).
- Transaction volumes are low and comparables are sparse.
- The valuation purpose requires a forward-looking view (development appraisal, SIPP pension valuations, long-term lease negotiations).
- You need to demonstrate a defensible, data-backed adjustment to a challenging party.
Stick to traditional methods alone when:
- The property type is standard, the market is liquid, and recent comparables are plentiful.
- The client or instructing party requires a purely RICS Red Book-compliant output with no supplementary modelling.
- Data quality in the local area is poor enough to make model outputs unreliable.
Common Mistakes When Using Big Data for Property Valuation
The most frequent error surveyors make when adopting big data analytics is treating model outputs as final answers rather than informed starting points. Other common mistakes include:
- Using national models for hyper-local markets. A model trained on UK-wide data will systematically misvalue properties in Liverpool's L1 or L8 postcodes because local regeneration dynamics are not adequately represented.
- Ignoring physical condition data. Transactional models cannot account for internal defects. Always cross-reference model outputs with findings from a physical building pathology assessment.
- Failing to update training data. A model trained on 2022-2023 transaction data will misread a market that has moved significantly in 2025-2026.
- Over-adjusting for predicted trends. Applying a regeneration uplift adjustment before planning approval is confirmed introduces speculative risk into a formal valuation.
- Not documenting the methodology. RICS standards require valuers to be able to explain and defend their adjustments. If a predictive model contributed to an adjustment, the methodology must be documented clearly.
Who Should Use Big Data Analytics for Building Surveys?
Big data analytics for predictive valuation adjustments is most valuable for chartered surveyors handling complex, high-stakes, or high-volume valuation work. It is less relevant for straightforward residential Level 2 homebuyer reports in stable, liquid markets.
High-value use cases by professional role:
- Valuation surveyors handling capital gains tax valuations, inheritance tax, or matrimonial disputes where the defensibility of the adjustment matters.
- Commercial surveyors assessing mixed-use or regeneration-adjacent assets.
- Building surveyors preparing condition-linked valuations for large portfolios.
- Property developers using predictive models to stress-test residual land values before acquisition.
- Landlords managing large residential portfolios who want to anticipate rental yield compression or capital value shifts driven by EPC compliance costs.
Smaller practices handling standard residential surveys can benefit from lighter-touch AVM cross-checks without building full predictive models in-house.
How to Implement Predictive Valuation in a Surveying Practice
Implementation follows a logical sequence. Rushing any stage increases the risk of producing unreliable outputs that damage professional credibility.
- Audit your current data inputs. Identify which data sources you already use and where gaps exist.
- Define the valuation problem clearly. Predictive models perform better when built for a specific purpose (e.g., EPC-driven adjustments for Victorian terraces in L-postcodes) rather than as general-purpose tools.
- Source and clean your training data. Land Registry and EPC register data require cleaning before use; duplicate records and data entry errors are common.
- Choose a model type. For most property valuation tasks, gradient boosting or hedonic regression models are appropriate starting points.
- Validate against held-out test data. Split your dataset: train on 80%, test on 20%. Measure MAPE before deploying the model in live valuations.
- Integrate with physical inspection findings. Build a workflow that combines model outputs with condition data from site visits.
- Document and review. Log every valuation where a predictive adjustment was applied, and review accuracy quarterly as new transaction data becomes available.
How Long Does It Take to See Results from Valuation Analytics?
Most surveying practices see measurable accuracy improvements within three to six months of implementing a well-configured predictive model, provided the training dataset is sufficiently large and recent. The timeline breaks down roughly as follows:
- Months 1-2: Data sourcing, cleaning, and model configuration.
- Month 3: Initial model validation against historical transactions.
- Months 4-6: Live deployment with parallel traditional analysis for cross-checking.
- Month 6 onwards: Accuracy review, model refinement, and expanded application to additional property types or geographies.
Practices that attempt to accelerate this timeline by skipping validation typically experience a period of over-confident outputs that require correction, which is more damaging to client trust than a slower, more careful rollout.
Predictive Valuation Adjustments for Residential vs Commercial Properties
Predictive models work differently for residential and commercial property, and surveyors should not apply the same model architecture to both asset classes.
Residential property benefits from large transaction volumes, standardised data (EPC, council tax, Land Registry), and relatively homogeneous comparable groups. Models can be trained on thousands of transactions and achieve good accuracy.
Commercial property presents more challenges: lower transaction volumes, greater heterogeneity, income-based valuation methods, and lease structures that transactional data does not capture. For commercial valuations, predictive analytics is most useful for market trend forecasting and comparable selection rather than direct AVM-style outputs.
In Liverpool specifically, the mixed-use regeneration zones around the waterfront and Knowledge Quarter create a third category: assets that share characteristics of both residential and commercial property, where bespoke models drawing on both datasets are necessary.
FAQ: Big Data Analytics for Predictive Valuation Adjustments
What is the difference between an AVM and a predictive valuation adjustment?
An automated valuation model (AVM) produces a point-in-time estimated value based on comparable data. A predictive valuation adjustment is a specific, justified modification to a valuation figure based on a forecast of how a known factor will affect value in the future. AVMs are an input; predictive adjustments are the professional output.
Do RICS standards allow the use of predictive analytics in formal valuations?
RICS Red Book standards require that valuations are based on evidence and that any adjustments are justified and documented. Predictive analytics outputs can support a formal valuation provided the methodology is transparent, the data sources are credible, and the surveyor retains professional responsibility for the final figure.
Is big data analytics relevant for smaller surveying practices in Liverpool?
Yes, at a basic level. Smaller practices may not build custom models, but using Land Registry data, EPC registers, and AVM cross-checks from PropTech platforms is accessible and adds value even without in-house data science capability.
What machine learning models work best for property valuation?
Gradient boosting models (XGBoost, LightGBM) and random forest models consistently outperform linear regression for residential property valuation in published UK research, because they handle non-linear relationships between variables such as location, size, and condition. Hedonic regression remains useful for producing interpretable outputs where the contribution of individual features needs to be explained to clients or courts.
How does building condition data feed into predictive valuation models?
Condition data from physical surveys (structural defects, EPC ratings, roof condition, damp) can be converted into numerical scores and added as model features. This is one area where surveyors have a genuine advantage over purely data-driven approaches: the physical inspection provides inputs that no transactional dataset contains.
Can predictive valuation adjustments be used for tax-related valuations?
Yes. For inheritance tax valuations and capital gains tax valuations, predictive adjustments can help establish a defensible historical value at a specific date, particularly when comparable evidence from that date is thin.
Conclusion
Big data analytics for predictive valuation adjustments represents a meaningful shift in how building surveyors can approach complex valuations, and Liverpool's property market, with its regeneration activity, diverse housing stock, and institutional research infrastructure at the University of Liverpool, provides a strong testbed for these methods in 2026.
The practical takeaway is straightforward: predictive analytics does not replace professional judgement or physical inspection, but it significantly strengthens the evidence base for valuation adjustments in markets where comparables alone are insufficient. Surveyors who combine rigorous physical assessment with well-validated data models will produce more defensible outputs, reduce the risk of under or over-valuation, and better serve clients in complex scenarios.
Actionable next steps for building surveyors:
- Start with publicly available data: Land Registry, EPC Register, and Environment Agency flood maps are free and immediately usable.
- Run a retrospective accuracy test: apply a simple hedonic model to 50 historical valuations in your core geography and measure the gap between model output and your final figure.
- Identify two or three valuation types in your practice where predictive adjustments would add the most value, such as regeneration-adjacent residential, EPC-sensitive stock, or contested matrimonial cases.
- Consider formal training: the University of Liverpool's MSc in Big Data Analytics (part-time online, starting September 2026) offers a structured pathway for surveyors wanting to build in-house capability.
- Document every adjustment methodology from day one, both for RICS compliance and to build a feedback loop that improves model accuracy over time.
For surveyors who want to understand what questions to ask before commissioning or applying any analytical tool to a survey, the key questions to ask during a building survey provide a useful professional framework.
.cg-tool{font-family:Arial,sans-serif;max-width:560px;margin:24px auto;border:1px solid #d0d7e2;border-radius:8px;padding:20px;background:#f8fafc}
.cg-tool h3{margin:0 0 4px;font-size:1rem;color:#1a2e4a}
.cg-tool p{margin:0 0 14px;font-size:.85rem;color:#4a5568}
.cg-row{display:flex;align-items:center;margin-bottom:10px;gap:10px}
.cg-row label{flex:1;font-size:.85rem;color:#2d3748}
.cg-row select{width:110px;padding:4px 6px;border:1px solid #b0bec5;border-radius:4px;font-size:.82rem}
.cg-btn{background:#1a2e4a;color:#fff;border:none;padding:9px 20px;border-radius:5px;cursor:pointer;font-size:.9rem;margin-top:6px}
.cg-btn:hover{background:#2a4a7a}
.cg-result{margin-top:14px;padding:12px;border-radius:6px;font-size:.88rem;display:none}
.cg-good{background:#e6f4ea;border-left:4px solid #34a853;color:#1a4a2a}
.cg-mid{background:#fff8e1;border-left:4px solid #f9a825;color:#4a3a00}
.cg-low{background:#fce8e6;border-left:4px solid #d93025;color:#4a0a00}
Predictive Valuation Data Readiness Checker
Rate your available data inputs to see if your practice is ready to build a predictive valuation model.
function cg_score(){
var ids=[“s1″,”s2″,”s3″,”s4″,”s5″],total=0,missing=0;
for(var i=0;i0){out.className=”cg-result cg-mid”;out.style.display=”block”;out.innerHTML=”Please answer all 5 questions to get your score.”;return;}
out.style.display=”block”;
if(total>=13){out.className=”cg-result cg-good”;out.innerHTML=”Strong readiness (“+total+”/15). Your data inputs support building a reliable predictive valuation model. Consider gradient boosting or hedonic regression as a starting point.”;}
else if(total>=8){out.className=”cg-result cg-mid”;out.innerHTML=”Moderate readiness (“+total+”/15). You can use AVM cross-checks now, but invest in improving EPC coverage and data recency before building a custom model.”;}
else{out.className=”cg-result cg-low”;out.innerHTML=”Low readiness (“+total+”/15). Focus on sourcing Land Registry, EPC Register, and flood risk data before attempting predictive modelling. Start with public datasets.”;}
}