London's 12-month price expectation net balance collapsed from +56% in January 2026 to just +7% in February — the sharpest single-month regional decline recorded in the RICS February 2026 Residential Survey. That one statistic reframes everything a valuer needs to know about approaching London property assessments in Q2 2026.
Valuation Adjustments for London Price Cooling in Q2 2026: RICS Strategies from February Residential Survey has rapidly become the defining professional challenge for chartered surveyors operating across the capital. The data demands a response — not panic, but precision. This article unpacks what the RICS February 2026 survey reveals, why London is diverging so sharply from national trends, and what practical valuation strategies surveyors and buyers should deploy right now.
Key Takeaways 📌
- London recorded a net balance of -40% for near-term price pressure — the worst of any UK region in February 2026 [1]
- The 12-month London price expectation plummeted from +56% to +7% in a single month, signalling a fundamental sentiment shift [1]
- Buyer enquiries nationally fell to -26%, shrinking comparable transaction evidence and increasing valuation uncertainty [1]
- Geopolitical events and renewed interest rate concerns are the twin drivers suppressing London's premium property segment [3]
- Surveyors must now employ differentiated, evidence-led methodologies — national averages actively mislead London-specific valuations [4]

Understanding the RICS February 2026 Data: What It Really Means for London
The Headline Numbers Behind London's Cooling Market
The RICS UK Residential Market Survey for February 2026 delivered a sobering set of metrics for London practitioners [1]. At the national level, the house price net balance registered -12% — a figure that sounds concerning but actually masks the severity of what is happening in the capital specifically.
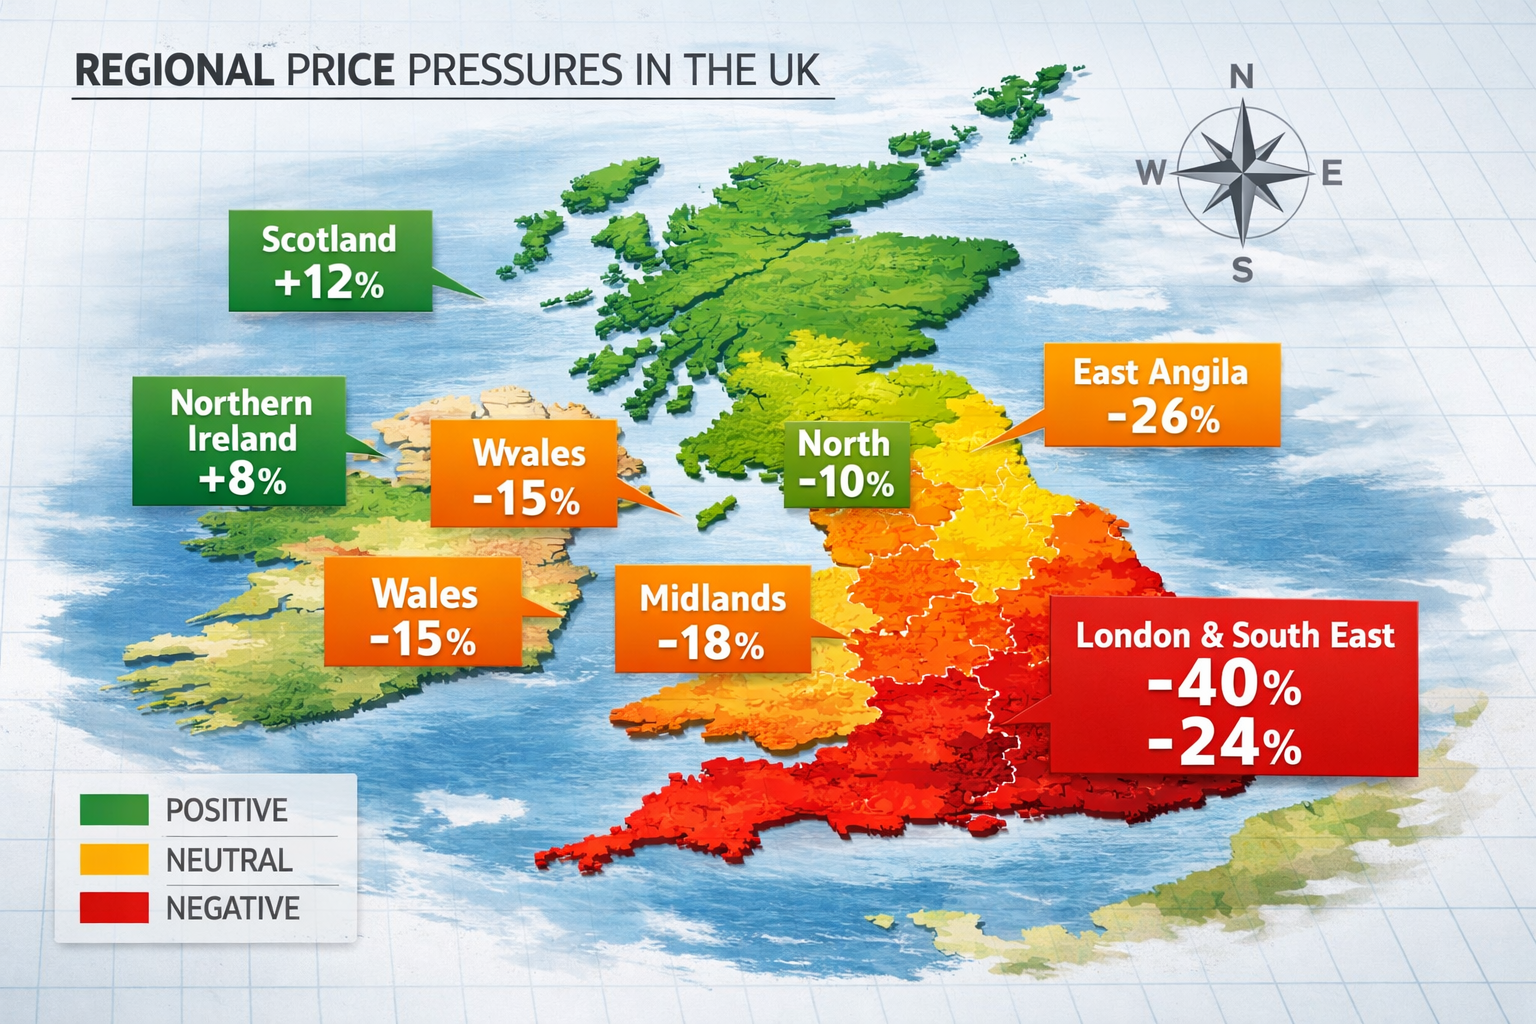
London's near-term price net balance hit -40%, meaning a substantial majority of surveyors operating in the capital reported falling rather than rising prices. To put that in context:
| Region | Near-Term Price Net Balance (Feb 2026) |
|---|---|
| London | -40% |
| South East | -24% |
| East Anglia | -26% |
| Northern Ireland | Positive |
| Scotland | Positive |
| North West | Positive |
| National Average | -12% |
Source: RICS February 2026 UK Residential Market Survey [1]
The regional divergence is stark. While Northern Ireland, Scotland, and the North West continue to record firmer price trends, southern England — and London in particular — is experiencing a correction that demands a fundamentally different valuation approach [1].
Why the 12-Month Expectation Collapse Matters Most
Short-term sentiment fluctuates. What makes the February 2026 data alarming for valuers is the collapse in long-term optimism. The 12-month price expectation net balance for London fell from +56% in January to just +7% in February [1]. That is not noise — it is a structural reassessment by professionals on the ground.
💬 "Residential prices across categories have plateaued since autumn 2025, with price negotiation creeping back into the market where sealed bids and gazumping were standard two years prior." — RICS February 2026 Survey Respondent [1]
This psychological shift is as important as the statistical one. When surveyors and agents stop expecting recovery, buyer behaviour changes, lenders tighten, and valuations must follow the evidence rather than historical optimism.
The Demand Collapse Feeding Valuation Uncertainty
New buyer enquiries fell to a net balance of -26% in February, down from -15% in January [1]. Fewer active buyers means fewer agreed sales, which means fewer comparable transactions — the bedrock of any robust residential valuation.
Agreed sales activity posted a -12% net balance, with near-term sales expectations at just -2% [1]. For valuers, this creates a compounding problem: not only are prices falling, but the evidence base for determining where prices now sit is thinning rapidly. This is precisely why valuation adjustments for London price cooling in Q2 2026 require strategic recalibration rather than simple mechanical downward adjustment.
Key Drivers of London's Price Cooling: Geopolitics, Rates, and Structural Shifts
Geopolitical Uncertainty Hits Premium Markets Hardest
The RICS February 2026 survey explicitly identified Middle East geopolitical events as a factor tempering buyer sentiment and reversing the market strengthening observed at the start of 2026 [1][3]. This is not a coincidence for London. The capital's prime and super-prime residential markets have historically attracted significant international buyer interest. When geopolitical uncertainty rises, that discretionary international demand retreats fastest.
Capital Economics noted that this geopolitical dampening effect arrived precisely as the market had begun to show early-year momentum, making the reversal more pronounced in the data [3].
Interest Rate Concerns Reshaping Affordability Calculations
Surveyors in February 2026 became measurably more cautious following renewed concerns over the interest rate outlook [1]. London's affordability challenge is the most acute in the UK — average property prices relative to average incomes remain at historically stretched multiples. Even modest upward pressure on mortgage rates translates into significant monthly payment increases for London buyers.
For valuers, this means:
- Mortgage-dependent buyers are qualifying for smaller loans than six months ago
- Investor yields are being recalculated against higher financing costs
- Refinancing risk is being priced into valuations for leveraged portfolios
Understanding what to do if your home valuation is less than an offer has become an increasingly relevant question as rate-driven downward adjustments create gaps between seller expectations and surveyor assessments.
Supply Stability: The One Stabilising Factor
Not all the data is negative. New instructions to agents remained stable at +2%, with market appraisals broadly unchanged [1]. This indicates the pipeline of new London stock is not creating additional downward pressure through oversupply. The cooling is demand-led, not supply-driven — an important distinction for valuation methodology.
A demand-led correction typically means:
- ✅ Price falls are more likely to stabilise once demand returns
- ✅ Properties in strong locations retain relative value better
- ⚠️ Time on market extends, requiring valuers to weight more recent evidence heavily
- ⚠️ Asking price-to-sold price gaps widen, making asking prices unreliable comparables
Valuation Adjustments for London Price Cooling in Q2 2026: RICS Strategies from February Residential Survey
Strategy 1: Reject National Averages as a Valuation Anchor
The most important strategic adjustment is methodological. The national headline price net balance of -12% is actively misleading when applied to London-specific valuations [1][4]. A surveyor using national trend data to calibrate a Hackney flat or a Richmond townhouse in Q2 2026 is working with the wrong instrument.
RICS-compliant valuers should:
- Weight regional data exclusively — use London borough-level evidence where available
- Discount asking price comparables — in a negotiation-returning market, agreed sale prices diverge materially from asking prices
- Apply temporal weighting — comparables older than three months should carry reduced evidential weight given the pace of sentiment change
- Document the adjustment rationale explicitly — RICS Red Book standards require clear reasoning for any departure from comparable evidence
For those working across chartered surveyors in North London markets, the borough-level granularity matters enormously — Islington and Barnet face different buyer pools and therefore different demand dynamics even within the same regional trend.
Strategy 2: Rebuild Comparable Evidence Through Alternative Sources
When agreed sales data thins — as the -12% sales net balance confirms it has [1] — valuers must expand their evidence toolkit:
| Evidence Type | Reliability in Thin Market | Notes |
|---|---|---|
| Recent agreed sales (0-3 months) | ⭐⭐⭐⭐⭐ | Gold standard, weight heavily |
| Asking prices (current listings) | ⭐⭐ | Discount for negotiation gap |
| Rental yields (investment properties) | ⭐⭐⭐⭐ | Useful cross-check for BTL |
| Auction results | ⭐⭐⭐⭐ | Reflect true market clearing prices |
| Historic sales (3-12 months) | ⭐⭐⭐ | Adjust for market movement |
A professional property valuation in the current London environment requires surveyors to triangulate across multiple evidence types rather than relying on a narrow comparable set.
Strategy 3: Segment by Property Type and Buyer Profile
Not all London property is cooling equally. The February 2026 data reflects aggregate sentiment, but sub-market segmentation is essential for accurate valuation adjustment:
- 🏠 Family homes in outer London boroughs: More exposed to mortgage rate sensitivity; buyer pool predominantly domestic and mortgage-dependent
- 🏢 Prime central London flats: More exposed to geopolitical-driven international demand retreat; less mortgage-sensitive but more sentiment-sensitive
- 🔑 New builds: Require separate consideration — understanding whether you need a survey on a new build is relevant here, as developer incentives can distort comparable evidence
- 📦 Investment properties: Yield recalculation against current financing costs is non-negotiable
Strategy 4: Communicate Uncertainty Ranges Transparently
In a market where the 12-month outlook dropped 49 percentage points in a single month, point valuations carry inherent uncertainty that must be communicated to clients. RICS guidance supports the use of valuation ranges in conditions of market uncertainty.
Practical steps include:
- Providing a central estimate with a stated confidence range (e.g., ±5%)
- Noting market conditions explicitly in the valuation report
- Recommending review timelines — a valuation conducted in Q2 2026 may require reassessment before exchange if the transaction timeline extends beyond 8-10 weeks
- Flagging the difference between Level 2 and Level 3 surveys when clients need comprehensive condition evidence to support negotiation positions
Strategy 5: Factor in the Return of Price Negotiation
RICS survey respondents explicitly noted that price negotiation is "creeping back into the market" after years of sealed bids and gazumping [1]. This is a fundamental shift in transaction psychology that affects valuation methodology.
When negotiation returns:
- The final agreed price increasingly sits below the initial asking price
- Valuers should apply a negotiation discount factor to asking price comparables
- Buyers gain leverage to request price reductions following survey findings — making a RICS building survey a more powerful negotiation tool than it has been in years
- Sellers who priced for a 2024-style market face the most significant downward adjustment risk

The South East and East Anglia: Coordinating Valuation Strategy Across the Cooling Zone
London does not sit in isolation. The South East recorded a -24% net balance and East Anglia -26% in February 2026 [1][4]. This creates a contiguous zone of pricing pressure across southern England that requires coordinated valuation strategy for surveyors operating across these markets.
For practitioners covering areas like Weybridge, Richmond, and Putney — all sitting within or adjacent to the South East pressure zone — the methodology developed for London markets translates directly.
Key cross-regional considerations:
- Commuter belt properties face dual pressure: London employment uncertainty and South East price correction
- Comparable selection should not cross regional boundaries without explicit adjustment factors
- Rental market evidence may be more stable than sales evidence in these markets, providing a useful valuation cross-check
The regional divergence also reinforces why national indices — whether RICS, Halifax, or Nationwide — should be used only as context, never as the primary valuation driver for southern England properties in Q2 2026.
What This Means for Buyers, Sellers, and Lenders
For Buyers 🏠
The return of negotiation represents genuine opportunity — but only for buyers who commission proper survey evidence to support their position. A comprehensive building survey identifying defects provides legitimate grounds for price renegotiation in a market where sellers are now more willing to accommodate.
For Sellers 📋
Sellers who benchmarked their asking price against 2024 or early 2025 transaction data need to recalibrate. The -40% London net balance means the majority of professional surveyors in the capital see prices falling. Resistance to realistic pricing will extend time on market, which in a declining sentiment environment typically means further price erosion.
For Lenders and Mortgage Professionals 🏦
The thin comparable evidence environment increases mortgage valuation risk. Lenders should expect:
- More frequent requests for additional comparable evidence from panel valuers
- Wider confidence intervals on valuations
- Increased scrutiny of properties where the agreed price sits materially above recent comparable evidence
Conclusion: Actionable Next Steps for Q2 2026
The data from the RICS February 2026 Residential Survey is unambiguous: London is experiencing its most significant valuation headwind in recent years, and the strategies appropriate for a rising or stable market are no longer fit for purpose.
Valuation Adjustments for London Price Cooling in Q2 2026: RICS Strategies from February Residential Survey demands a response built on evidence, transparency, and regional precision. Here are the actionable priorities:
- ✅ Immediately audit your comparable selection methodology — eliminate national averages as a calibration tool for London and South East valuations
- ✅ Expand your evidence base — incorporate auction results, rental yields, and adjusted historic comparables when recent agreed sales data is thin
- ✅ Segment your analysis — apply different adjustment frameworks for prime central, outer London family homes, and investment properties
- ✅ Communicate uncertainty explicitly — use ranges, note market conditions, and recommend review timelines in all London valuation reports
- ✅ Brief clients on the negotiation return — buyers and sellers both need to understand that the transaction psychology of 2022-2024 no longer applies
- ✅ Monitor monthly RICS data — the pace of change in February 2026 (a 49-point drop in 12-month expectations) means quarterly reviews of methodology are insufficient; monthly recalibration is now necessary
For surveyors, buyers, and property professionals navigating this environment, working with experienced chartered surveyors who understand London's micro-market dynamics is not a luxury — it is the essential foundation of sound property decisions in Q2 2026.
References
[1] UK Residential Survey February 2026 – https://www.rics.org/news-insights/uk-residential-survey-february-2026
[2] UK Residential Market Survey February 2026 – https://www.rics.org/content/dam/ricsglobal/documents/market-surveys/uk-residential-market-survey/UK-Residential-Market-Survey_February-2026.pdf
[3] UK RICS Residential Market Survey Feb 2026 – https://www.capitaleconomics.com/publications/uk-housing-market-update/uk-rics-residential-market-survey-feb-2026
[4] Valuation Impacts of February 2026 RICS Survey: Strategies for Regional Price Divergence in UK Markets – https://nottinghillsurveyors.com/blog/valuation-impacts-of-february-2026-rics-survey-strategies-for-regional-price-divergence-in-uk-markets