While property markets across the UK show tentative signs of recovery in early 2026, East Anglia remains stubbornly behind the curve. The region's persistent affordability challenges and lagging price performance demand specialized valuation approaches that account for unique regional dynamics. Understanding Valuation Techniques for East Anglia's Lagging Recovery: Bridging Affordability Gaps with RICS January 2026 Insights has become essential for chartered surveyors, property professionals, and investors navigating this complex landscape.
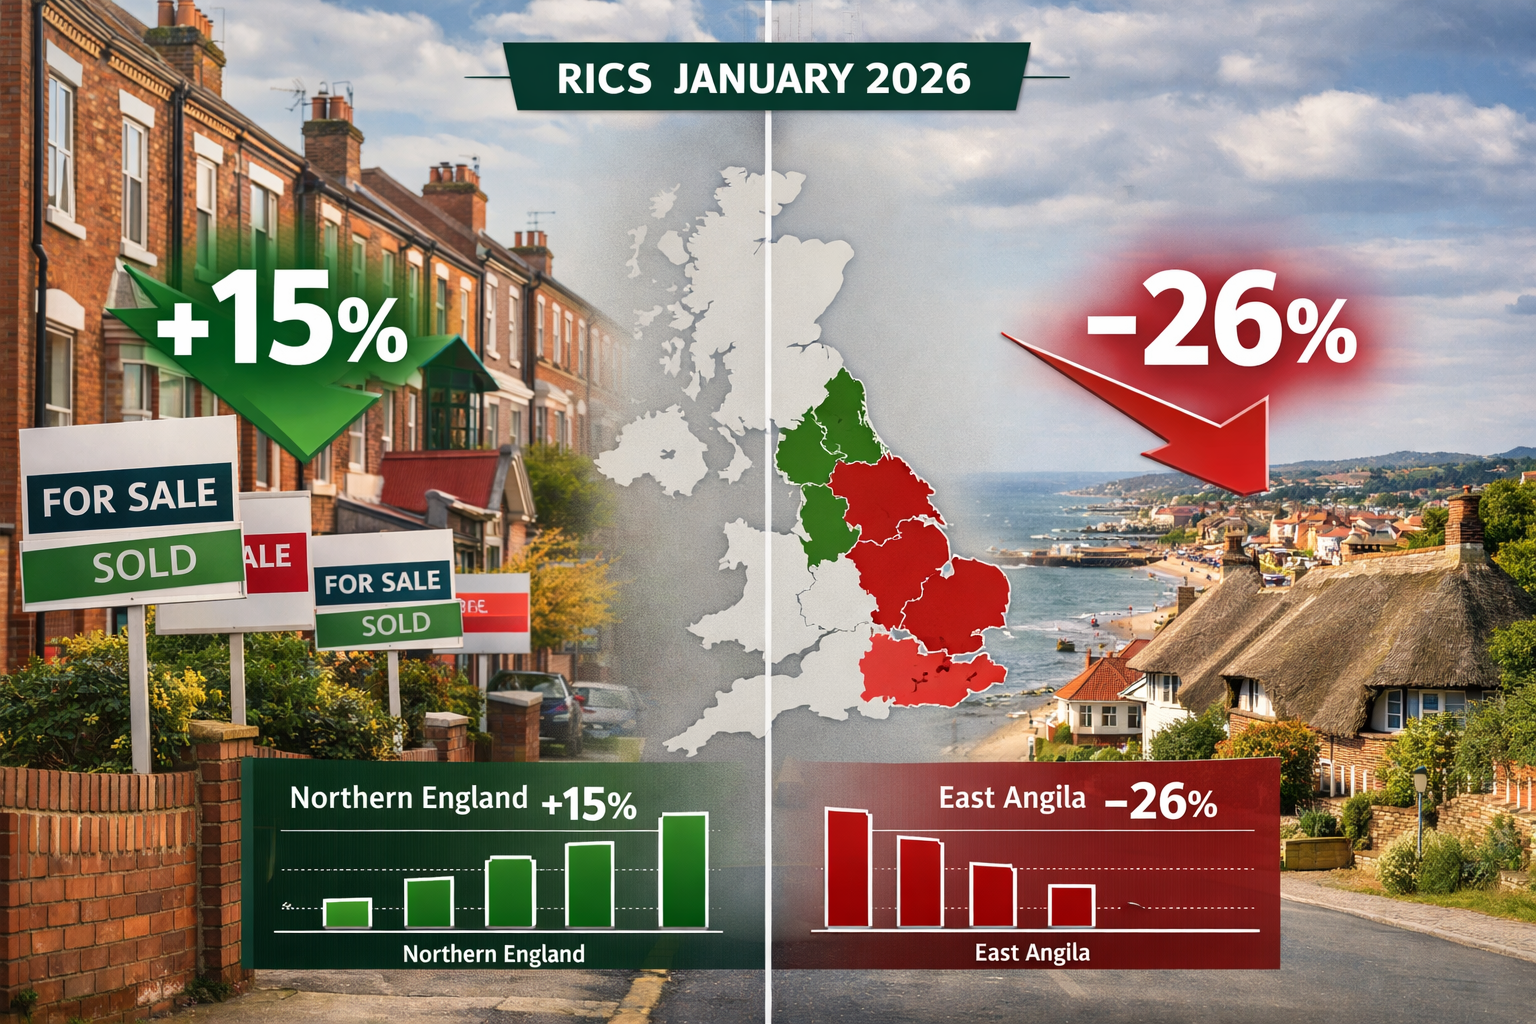
The latest RICS data paints a stark picture: East Anglia recorded a net balance of -26% for price trends in January 2026, significantly worse than the national average of -10%[1]. This disparity signals that while northern regions experience robust recovery, East Anglia—alongside London and the South East—continues to face downward pressure on property values. For surveyors and valuers, this creates both challenges and opportunities to apply precision techniques that reflect true market conditions.
Key Takeaways
- 📉 East Anglia's price trend net balance stands at -26%, substantially below the national average, indicating persistent regional weakness in property values
- 🏘️ Affordability barriers continue to constrain buyer participation in East Anglia despite improving national buyer enquiry levels
- 📊 Regional valuation adjustments must account for the 16-percentage-point gap between East Anglia and national performance metrics
- 🔍 Comparative market analysis techniques require enhanced precision when limited inventory and weak appraisal activity affect data quality
- 💡 RICS January 2026 insights provide critical benchmarks for adjusting traditional valuation methodologies to reflect lagging regional recovery patterns
Understanding East Anglia's Market Position in the 2026 Recovery Context
The Regional Performance Gap
The Valuation Techniques for East Anglia's Lagging Recovery: Bridging Affordability Gaps with RICS January 2026 Insights framework begins with recognizing the substantial performance gap between East Anglia and other UK regions. While the national house price net balance improved from -19% in October 2025 to -10% in January 2026, East Anglia's position remained stubbornly negative at -26%[1][2].
This disparity isn't merely statistical—it reflects fundamental differences in regional economic conditions, affordability pressures, and buyer sentiment. The February 2026 RICS survey confirmed this persistent weakness, with East Anglia maintaining its -26% reading even as other regions showed incremental improvement[4].
Regional Comparison Table:
| Region | Price Trend Net Balance (Jan 2026) | Change from Oct 2025 | Recovery Status |
|---|---|---|---|
| National Average | -10% | +9 points | Improving ✅ |
| East Anglia | -26% | +3 points | Lagging ⚠️ |
| North | +15% | +12 points | Strong Recovery 🚀 |
| London | -24% | +5 points | Lagging ⚠️ |
| South East | -22% | +6 points | Lagging ⚠️ |
Affordability as the Primary Constraint
The affordability challenge in East Anglia manifests differently than in London or the South East. While those markets face absolute price barriers, East Anglia's issues stem from the relationship between local incomes and property values. The region's rural character, combined with proximity to higher-wage areas, creates affordability pressures that traditional valuation models may not fully capture.
New buyer enquiries improved nationally to -15% in January 2026 (from -29% in November 2025)[1], yet this recovery hasn't uniformly extended to East Anglia. The region's affordability barriers limit participation in the broader market recovery, creating a demand-constrained environment that requires careful valuation consideration.
For professionals conducting commercial valuations or matrimonial valuations, understanding these regional constraints becomes critical to producing defensible valuations.
Core Valuation Techniques for East Anglia's Lagging Recovery
Comparative Market Analysis with Regional Adjustments
Traditional comparative market analysis (CMA) forms the foundation of residential valuation, but applying this technique in East Anglia's lagging market requires enhanced sophistication. With appraisal activity registering only -11% nationally[3], the pool of comparable transactions remains limited, demanding greater analytical rigor.
Key CMA Adjustments for East Anglia:
- Time-Based Adjustments: Apply monthly depreciation factors reflecting the -26% net balance rather than national averages
- Location Premium Recalibration: Reassess traditional location premiums given changing affordability dynamics
- Condition Weighting: Increase emphasis on property condition as buyers become more price-sensitive
- Amenity Value Adjustment: Recalculate the value contribution of features like gardens, parking, or period characteristics
When conducting a capital gains valuation or right to buy valuation, these regional adjustments ensure that historical values are appropriately indexed to current market realities.
Income Capitalization for Rental Properties
For investment properties in East Anglia, income capitalization methods provide stability when sales comparables become unreliable. This approach values properties based on their income-generating potential rather than volatile sales prices.
Income Capitalization Formula:
Property Value = Net Operating Income (NOI) ÷ Capitalization Rate
In East Anglia's current market, determining the appropriate capitalization rate requires careful consideration of:
- Regional risk premium: Add 0.5-1.0% to account for lagging recovery and affordability constraints
- Tenant demand stability: Assess rental market strength independent of sales market weakness
- Exit strategy complexity: Factor in potential holding period extensions given slow price recovery
This technique proves particularly valuable for leasehold extension valuations, where future income streams must be reliably projected despite current market uncertainty.
Cost Approach with Depreciation Modeling
The cost approach—calculating replacement cost minus depreciation—gains relevance in markets where sales comparables are scarce or unreliable. For East Anglia properties, particularly unique or rural assets, this method provides an independent value indicator.
Enhanced Depreciation Modeling includes:
- Economic obsolescence factor: Quantify the value loss attributable to regional market conditions (typically 5-15% in lagging markets)
- Functional obsolescence assessment: Evaluate how changing buyer preferences affect value
- Physical depreciation: Standard age-life or condition-based depreciation
- External obsolescence: Account for location-specific factors affecting marketability
Surveyors conducting Level 3 full building surveys can integrate cost approach valuations with detailed condition assessments to provide comprehensive property analysis.
Residual Valuation for Development Opportunities
Despite market weakness, development opportunities exist in East Anglia, particularly for affordable housing schemes. The residual valuation method—working backward from gross development value—helps identify viable projects.
Residual Valuation Framework:
Land Value = Gross Development Value - (Construction Costs + Profit + Fees)
In East Anglia's context, this requires:
- Conservative GDV projections: Use lower quartile pricing rather than median values
- Extended development timelines: Factor in slower absorption rates
- Enhanced contingency reserves: Increase from standard 5% to 7-10%
- Affordable housing requirements: Account for Section 106 obligations affecting viability

Bridging Affordability Gaps: Practical Valuation Strategies
Segmented Market Analysis
Valuation Techniques for East Anglia's Lagging Recovery: Bridging Affordability Gaps with RICS January 2026 Insights emphasizes the importance of market segmentation. East Anglia's property market isn't monolithic—performance varies significantly by:
Price Band Segmentation:
- Entry-level (£150,000-£250,000): Relatively resilient demand from first-time buyers and downsizers
- Mid-market (£250,000-£400,000): Most affected by affordability constraints; showing steepest declines
- Upper-market (£400,000+): Niche demand from lifestyle buyers; less price-sensitive but volume-constrained
Geographic Micro-Markets:
- Coastal towns: Tourism-driven economies showing different dynamics than inland areas
- Commuter corridors: Proximity to Cambridge or London creating localized demand
- Rural villages: Unique valuation challenges with limited comparables
- Market towns: Traditional centers showing varying resilience
Surveyors must stratify their comparable selection by these segments rather than treating East Anglia as a uniform market. This precision becomes especially important for matrimonial valuations where accuracy directly impacts financial settlements.
Affordability Ratio Integration
Traditional valuation methods rarely explicitly incorporate affordability metrics, yet these ratios increasingly drive market behavior in constrained regions. Integrating affordability analysis provides context for valuation conclusions.
Key Affordability Metrics:
- Price-to-Income Ratio: East Anglia median house price ÷ median household income
- Mortgage Affordability Index: Required income for median property at current rates
- Rental Yield Comparison: Gross rental yield versus mortgage costs
- Deposit Barrier Assessment: Required deposit as percentage of median savings
When these ratios exceed historical norms by 20% or more, valuation adjustments become warranted. For example, if the local price-to-income ratio reaches 9:1 compared to a historical average of 7:1, applying a 5-10% market adjustment to comparable sales may be appropriate.
Forward-Looking Indicators
While RICS data shows East Anglia at -26% for current prices, the twelve-month price expectations nationally reached +43% in January 2026[1]. This disconnect between current weakness and future optimism requires careful navigation in valuation reports.
Balancing Current and Projected Values:
- Primary valuation: Base on current market evidence and recent transactions
- Commentary section: Discuss forward-looking indicators and recovery prospects
- Sensitivity analysis: Provide value ranges under different recovery scenarios
- Assumption disclosure: Clearly state whether valuation reflects current distress or normalized conditions
This approach proves particularly valuable for capital gains valuations, where the valuation date may fall during a market trough but tax planning requires understanding potential recovery trajectories.
Data Quality and Inventory Constraints
The RICS January 2026 survey revealed that new instructions registered only +1% net balance[1], indicating minimal month-on-month movement in property listings. This inventory constraint directly affects valuation reliability.
Strategies for Limited Data Environments:
- Expand geographic search radius: Include neighboring areas with similar characteristics
- Extend time horizon: Use 12-18 month comparable window rather than standard 6 months
- Weight recent transactions: Apply exponential weighting favoring most recent sales
- Supplement with rental data: Use rental market evidence to corroborate value conclusions
- Expert judgment documentation: Clearly articulate reasoning when data gaps exist
Professional surveyors should consider comprehensive building surveys to gather primary property data when secondary market data proves insufficient.

RICS Standards and Professional Practice Considerations
Red Book Compliance in Challenging Markets
The RICS Valuation – Global Standards (Red Book) provides the framework for professional valuation practice, but applying these standards in East Anglia's lagging market requires careful interpretation.
Critical Red Book Considerations:
- Market Value Definition: Ensure valuations reflect "the estimated amount for which an asset should exchange" in current conditions, not aspirational recovery values
- Assumptions and Special Assumptions: Clearly distinguish between standard market assumptions and special assumptions required by limited data
- Uncertainty and Material Valuation Uncertainty: Consider whether East Anglia's market conditions warrant material valuation uncertainty declarations
- Departures from Standards: Document any necessary departures with clear justification
The January 2026 RICS data provides objective evidence of market conditions that supports professional judgment in applying these standards[1][2].
Valuation Reporting Best Practices
High-quality valuation reports in East Anglia's current market should include:
Essential Report Components:
- ✅ Executive summary with clear value conclusion and confidence level
- ✅ Market context section referencing RICS regional data and affordability analysis
- ✅ Methodology justification explaining technique selection given market conditions
- ✅ Comparable analysis table with detailed adjustments and weighting rationale
- ✅ Assumptions register listing all material assumptions affecting value
- ✅ Sensitivity analysis showing value ranges under alternative scenarios
- ✅ Limiting conditions clearly stated, particularly regarding data limitations
For specialized valuations like leasehold extensions, these reporting standards ensure defensibility in potential tribunal proceedings.
Continuing Professional Development
The rapidly evolving market conditions highlighted by Valuation Techniques for East Anglia's Lagging Recovery: Bridging Affordability Gaps with RICS January 2026 Insights underscore the importance of ongoing professional development.
Recommended CPD Focus Areas:
- Regional economic analysis and forecasting techniques
- Advanced statistical methods for limited data environments
- Affordability modeling and housing policy impacts
- Risk assessment and uncertainty quantification
- Technology tools for enhanced market analysis
Surveyors should regularly review RICS monthly survey data to track evolving regional conditions and adjust valuation approaches accordingly.
Technology and Data Analytics in Regional Valuation
Leveraging Technology for Enhanced Accuracy
Modern valuation technology offers solutions to some challenges posed by East Anglia's lagging recovery. Automated Valuation Models (AVMs) and data analytics platforms can supplement traditional approaches when properly calibrated.
Technology Applications:
- Hedonic pricing models: Statistical analysis of property characteristics and value relationships
- Geographic Information Systems (GIS): Spatial analysis of price trends and micro-market identification
- Machine learning algorithms: Pattern recognition in limited datasets
- Real-time market monitoring: Tracking new listings, price changes, and transaction volumes
However, technology must be applied judiciously. AVMs trained on national data may systematically overvalue East Anglia properties given the region's underperformance relative to national trends.
Data Sources Beyond Traditional Comparables
When transaction data proves limited, professional valuers can supplement analysis with:
Alternative Data Sources:
- Land Registry price paid data: Historical transaction evidence
- Rental market platforms: Rightmove, Zoopla rental listings
- Mortgage approval data: Council of Mortgage Lenders statistics
- Planning application databases: Development pipeline indicators
- Economic indicators: Local employment, wage growth, demographic trends
Integrating these diverse data sources creates a more robust evidentiary foundation for valuation conclusions in data-constrained environments.
Case Study Applications: Practical Scenarios
Scenario 1: First-Time Buyer Property Valuation
Property: 2-bedroom terrace house in East Anglia market town
Context: Buyer seeking mortgage valuation; lender requires conservative assessment
Valuation Approach:
- Primary method: Comparative market analysis with -26% regional adjustment
- Supporting method: Income approach using rental comparables
- Key consideration: Entry-level segment showing relative resilience
- Adjustment factors: Condition (good), location (town center), recent comparable within 3 months
Conclusion: Value at lower end of comparable range, acknowledging affordability constraints but recognizing segment-specific demand.
Scenario 2: Rural Estate with Development Potential
Property: 5-acre rural site with period farmhouse
Context: Estate planning valuation for inheritance tax purposes
Valuation Approach:
- Primary method: Residual valuation for development potential
- Supporting method: Cost approach for existing structures
- Key consideration: Limited comparables; unique property characteristics
- Special assumptions: Planning permission obtainable for 4 additional dwellings
Conclusion: Weighted average of existing use value and development value, with material valuation uncertainty declaration given market conditions.
Scenario 3: Commercial Property in Coastal Town
Property: Retail unit with residential flat above
Context: Lease renewal negotiation requiring market rent assessment
Valuation Approach:
- Primary method: Income capitalization using comparable rents
- Supporting method: Profits method for retail component
- Key consideration: Tourism-driven economy creating seasonal variation
- Regional factor: Coastal micro-market showing different dynamics than inland areas
Conclusion: Market rent reflecting current trading conditions with provision for rent review linked to turnover given market uncertainty.
Future Outlook and Strategic Recommendations
Recovery Timeline Projections
While East Anglia currently lags at -26%, the national twelve-month price expectations of +43%[1] suggest eventual recovery. However, regional recovery will likely lag national trends by 6-12 months.
Projected Recovery Phases:
- Q2-Q3 2026: Stabilization phase—negative balance narrows to -15% to -20%
- Q4 2026-Q1 2027: Early recovery—movement toward neutral (0%) balance
- Mid-2027: Positive territory—regional balance turns positive, though below national average
- Late 2027+: Normalization—regional performance converges with national trends
These projections assume no major economic shocks and gradual improvement in affordability conditions through wage growth and price stabilization.
Strategic Recommendations for Surveyors
For Valuation Professionals:
- 🎯 Maintain regional specialization: Deep local knowledge becomes increasingly valuable in differentiated markets
- 📊 Enhance data collection: Build proprietary databases of local transactions and market intelligence
- 🔄 Regular methodology review: Reassess valuation approaches quarterly as market conditions evolve
- 🤝 Collaborate with local agents: Strengthen relationships with estate agents for real-time market insights
- 📚 Document thoroughly: Enhanced documentation protects against challenge in uncertain markets
For Property Investors:
- Contrarian opportunities: Lagging regions often present value for patient capital
- Income focus: Prioritize rental yield over capital appreciation in near term
- Selective acquisition: Target properties in resilient micro-markets within broader region
- Long-term horizon: Position for 2027+ recovery rather than short-term gains
For Homeowners:
- Realistic pricing: Acknowledge regional conditions when listing properties
- Condition optimization: Invest in improvements that enhance relative competitiveness
- Timing flexibility: Where possible, delay discretionary sales until recovery strengthens
- Professional advice: Engage qualified surveyors for accurate valuation guidance
Conclusion
The Valuation Techniques for East Anglia's Lagging Recovery: Bridging Affordability Gaps with RICS January 2026 Insights framework provides essential guidance for navigating one of the UK's most challenging regional property markets in 2026. With East Anglia recording a -26% price trend net balance—substantially worse than the -10% national average—professional surveyors must adapt traditional valuation methodologies to reflect these unique conditions[1][4].
The key to successful valuation in this environment lies in precision and context. Comparative market analysis requires enhanced regional adjustments, income capitalization methods gain importance for investment properties, and cost approaches provide independent value indicators when transaction data proves limited. Throughout all approaches, explicit consideration of affordability constraints—the primary driver of East Anglia's underperformance—ensures valuations reflect genuine market dynamics rather than outdated assumptions.
Critical Success Factors:
✅ Apply regional adjustments reflecting the 16-percentage-point gap between East Anglia and national performance
✅ Segment analysis by price band and micro-market rather than treating the region uniformly
✅ Integrate affordability metrics explicitly into valuation frameworks
✅ Balance current market evidence with forward-looking recovery indicators
✅ Maintain rigorous RICS Red Book compliance with enhanced documentation
✅ Leverage technology and alternative data sources to supplement limited transaction evidence
As the national market shows tentative recovery signs—with buyer enquiries improving to -15% and twelve-month price expectations reaching +43%[1]—East Anglia will eventually participate in this broader recovery. However, the region's affordability challenges and structural constraints suggest this recovery will lag by 6-12 months, creating both challenges and opportunities for informed professionals.
Actionable Next Steps
For surveyors and property professionals working in East Anglia:
- Review current valuation methodologies against RICS January 2026 regional data to ensure appropriate adjustments
- Develop regional expertise through focused CPD on East Anglia market dynamics and affordability analysis
- Build comprehensive databases of local transactions, rental data, and market intelligence
- Establish monitoring systems to track monthly RICS survey data and adjust approaches as conditions evolve
- Enhance reporting practices to clearly communicate market context and valuation uncertainty
- Consider specialist services such as commercial valuations or capital gains valuations that require regional precision
The path forward requires combining professional judgment with robust data analysis, maintaining RICS standards while adapting to regional realities, and positioning for eventual recovery while accurately reflecting current conditions. By applying the valuation techniques and insights outlined in this analysis, property professionals can navigate East Anglia's challenging market with confidence and precision.
References
[1] Uk Resi Survey Jan 2026 Report Shows Early Signs Market Recovery Despite Caution – https://www.rics.org/news-insights/uk-resi-survey-jan-2026-report-shows-early-signs-market-recovery-despite-caution
[2] Uk Residential Market Survey January 2026 – https://www.rics.org/content/dam/ricsglobal/documents/market-surveys/uk-residential-market-survey/UK-Residential-Market-Survey_January-2026.pdf
[3] Rics Residential Market Survey January 2026 – https://www.retaileconomics.co.uk/retail-insights-trends/rics-residential-market-survey-january-2026?slug=retail-economic-news
[4] Uk Residential Survey February 2026 – https://www.rics.org/news-insights/uk-residential-survey-february-2026
[5] Uk Residential Market Survey February 2026 – https://www.rics.org/content/dam/ricsglobal/documents/market-surveys/uk-residential-market-survey/UK-Residential-Market-Survey_February-2026.pdf