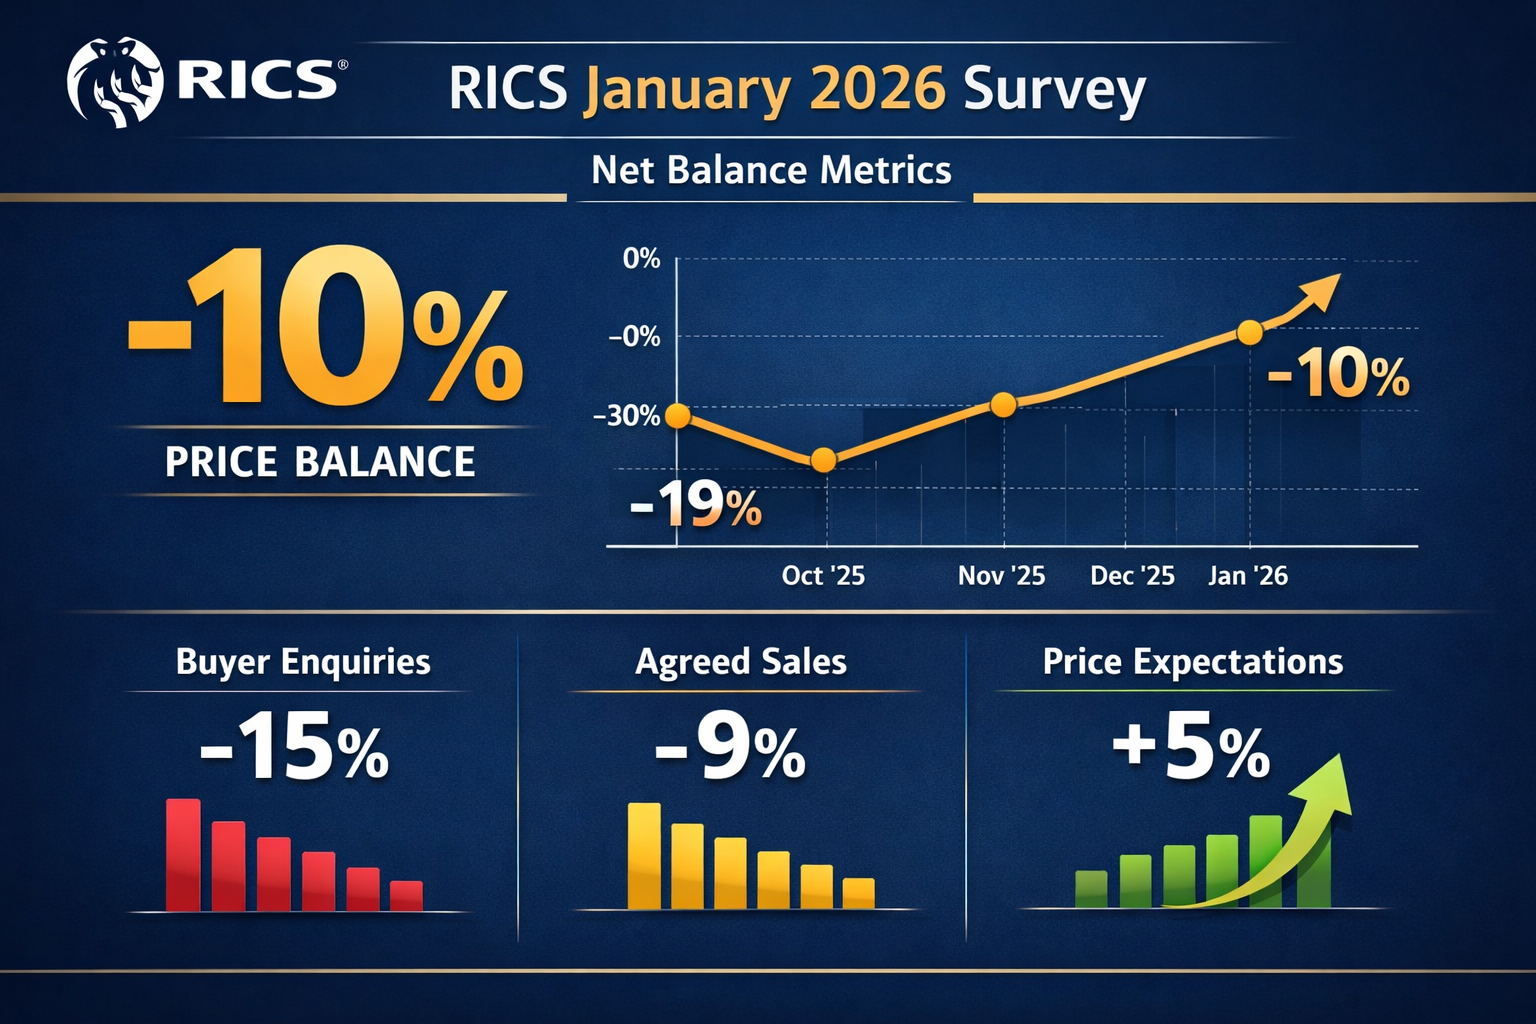
The UK housing market has reached a critical turning point. After months of uncertainty and declining confidence, January 2026 marks a decisive shift in market dynamics that chartered surveyors must understand to deliver accurate property valuations. The latest RICS Residential Market Survey reveals that house prices at the national level are finally stabilising, with the net balance for prices over the past three months standing at -10%—a significant improvement from the low of -19% recorded in October 2025[1]. This stabilisation presents both opportunities and challenges for valuation professionals navigating regional divergences and evolving market conditions.
Understanding the Valuation Impacts of Stabilising House Prices: RICS Techniques from January 2026 Survey Data is essential for chartered surveyors seeking precision in their assessments. The data reveals not just national trends, but critical regional variations that demand tailored valuation approaches, particularly as Northern England emerges as a standout performer while Southern regions continue to lag behind.
Key Takeaways
- National price stabilisation achieved: The net balance for house prices improved to -10% in January 2026, up from -19% in October 2025, marking a clear trend reversal that reduces downward pressure on valuations[1]
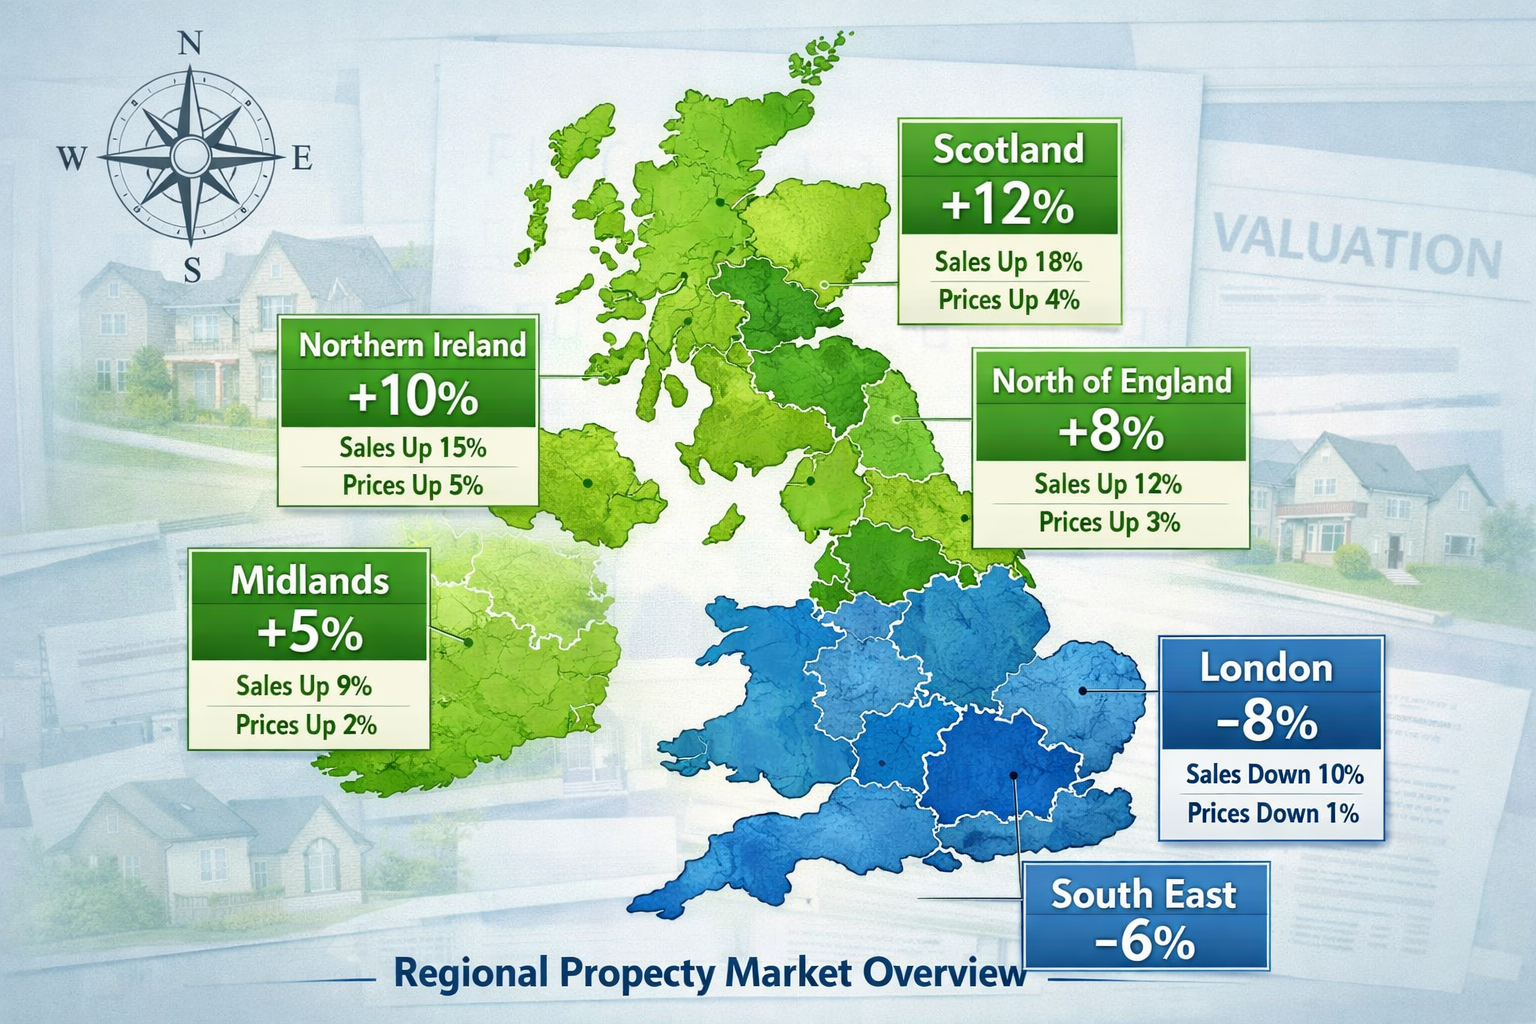
- Regional divergence requires precision: Scotland, Northern Ireland, and Northern England show positive price growth, while London and the South East continue to lag, necessitating differentiated valuation techniques[1]
- Strong twelve-month outlook: A net balance of +43% of respondents anticipate higher prices over the year ahead—the most positive outlook since February 2025—indicating increased confidence in future valuations[1]
- Short-term caution remains: Near-term expectations point to a broadly flat outlook over the coming three months (net balance at -4%), suggesting valuers should exercise measured judgment in immediate price projections[3]
- Transaction data improving: Agreed sales reached -9%, the least negative reading since June 2025, providing valuers with more reliable comparable evidence for assessments[1]
Understanding the National Stabilisation Context
The Journey from Decline to Stability
The housing market's trajectory over the past six months tells a compelling story of recovery. Between October 2025 and January 2026, the net balance for house prices improved by nine percentage points, moving from -19% to -10%[1]. This steady improvement reflects easing economic pressures and growing market confidence that directly impacts how chartered surveyors approach property valuations.
New buyer enquiries have shown particularly strong improvement, with the net balance rising to -15% in January, up from -21% in December and -29% in November[1]. This upward trend in demand signals reduced downward pressure on property values, allowing surveyors to adopt more confident valuation positions when assessing properties for purchase, mortgage lending, or investment purposes.
According to RICS Chief Economist Simon Rubinsohn, "There are early signs that market conditions may be improving after a challenging period, although activity levels are still subdued, meaning any recovery is likely to be gradual"[1]. This measured perspective is crucial for valuation professionals who must balance current stabilisation against the reality of continued market caution.
Key Metrics Driving Valuation Confidence
The January 2026 RICS survey provides several critical data points that inform valuation methodology:
| Metric | January 2026 Net Balance | Previous Low Point | Improvement |
|---|---|---|---|
| House Prices (3-month) | -10% | -19% (Oct 2025) | +9 points |
| Buyer Enquiries | -15% | -29% (Nov 2025) | +14 points |
| Agreed Sales | -9% | Lowest since June 2025 | Significant |
| 12-month Price Expectations | +43% | Most positive since Feb 2025 | Strong |
| 12-month Sales Expectations | +35% | Strongest since Dec 2024 | Robust |
These metrics demonstrate that while the market remains in slightly negative territory for immediate indicators, the trajectory is clearly positive. For chartered surveyors conducting property valuations, this stabilisation reduces the risk of significant downward adjustments and provides greater confidence in comparable evidence from recent transactions.
Transaction Volume and Comparable Evidence
One of the most significant valuation challenges during periods of market uncertainty is the scarcity of reliable comparable evidence. The January 2026 data shows that agreed sales reached a net balance of -9%, representing the least negative reading since June 2025[1]. This improvement means valuers now have access to more recent transaction data to support their assessments.
However, the three-month sales expectations eased to a net balance of +4%[1], indicating that while the immediate outlook shows modest improvement, transaction volumes are likely to remain subdued in the short term. This reality requires surveyors to cast a wider net when gathering comparable evidence, potentially looking at transactions over a longer time period while applying appropriate adjustments for market movement.
When conducting a building survey or valuation assessment, professionals must now consider:
- Time adjustments: How market conditions have evolved between the comparable sale date and the valuation date
- Regional variations: Whether the comparable property is in a similar regional market showing comparable trends
- Property type performance: How different property types are performing within the stabilising market
- Condition premiums: Whether well-maintained properties are commanding disproportionate premiums in a cautious market
Regional Divergence: Valuation Impacts of Stabilising House Prices Across UK Markets
Northern Powerhouse: Scotland, Northern Ireland, and Northern England
The most striking feature of the Valuation Impacts of Stabilising House Prices: RICS Techniques from January 2026 Survey Data is the pronounced regional divergence in market performance. While national figures show stabilisation, certain regions are experiencing genuine growth that fundamentally alters valuation approaches.
Scotland and Northern Ireland continue to demonstrate the strongest price growth, with upward trends also firmly established in the North West and North of England[1]. Northern England has emerged as a particularly standout performer in Q1 2026, with respondents consistently reporting prices moving higher across the region[8]. This represents a significant shift in valuation momentum away from traditional London-centric market leadership.
For chartered surveyors working in these regions, the implications are substantial:
✅ Positive valuation adjustments: Properties in these areas may warrant upward adjustments from historical comparable evidence, particularly where recent sales occurred during the October-December 2025 period when national sentiment was more negative.
✅ Stronger buyer competition: The improved demand dynamics in Northern regions mean that properties in desirable locations may achieve prices at or above asking, supporting more confident valuation positions.
✅ Investment appeal: The relative affordability of Northern properties combined with positive price momentum makes these markets attractive for property development and investment purposes, potentially justifying higher development land values.
Southern Lag: London, South East, and East Anglia
In stark contrast, London, the South East, South West, and East Anglia continue to lag behind the national average, reflecting ongoing affordability challenges[1]. While conditions in these areas have improved modestly, the recovery remains fragile and uneven.
This southern lag creates specific valuation challenges:
⚠️ Cautious comparable analysis: Recent sales in these regions may not reflect stabilisation seen elsewhere, requiring surveyors to carefully assess whether comparable evidence truly represents current market conditions.
⚠️ Affordability constraints: High property prices relative to local incomes continue to suppress demand, meaning valuers should be conservative when projecting future appreciation for mortgage lending purposes.
⚠️ Segment-specific performance: Within these regions, certain property types and price brackets may perform differently, requiring granular market analysis rather than broad regional assumptions.
For professionals conducting a RICS homebuyers report in Southern England, the January 2026 data suggests maintaining a measured approach to valuation, avoiding over-optimistic projections based on national stabilisation trends that may not yet be fully reflected in local markets.
Practical Regional Adjustment Techniques
When applying the RICS Techniques from January 2026 Survey Data to regional valuations, chartered surveyors should implement a structured adjustment framework:
1. Regional Performance Indexing
Create a regional adjustment matrix based on the RICS net balance data:
- Strong growth regions (Scotland, NI, Northern England): Apply +2% to +5% positive adjustment to comparable evidence from Q4 2025
- National average regions: Apply +1% to +2% adjustment reflecting general stabilisation
- Lagging regions (London, South East): Apply 0% to +1% adjustment, maintaining conservative stance
2. Time-Based Market Movement Adjustments
Given the nine-point improvement in national net balance from October to January, apply monthly time adjustments:
- October 2025 comparables: +3% adjustment to reflect improved market sentiment
- November 2025 comparables: +2% adjustment
- December 2025 comparables: +1% adjustment
- January 2026 comparables: Minimal adjustment required
3. Property Type Segmentation
Different property types respond differently to stabilisation:
- Family homes in strong regions: Most responsive to positive trends
- First-time buyer properties: Benefiting from improved mortgage availability
- High-value properties in Southern regions: Slower to respond to stabilisation
Understanding what to do if your home valuation is less than an offer becomes particularly relevant in this divergent market, where regional variations can create significant gaps between buyer expectations and valuation outcomes.
RICS Valuation Techniques for Stabilising Markets
Applying the Red Book Standards in 2026
The RICS Valuation – Global Standards (Red Book) provides the foundational framework for all professional valuations, but applying these standards in a stabilising market requires particular attention to several key principles:
Market Value Definition Considerations
The Red Book defines Market Value as "the estimated amount for which an asset or liability should exchange on the valuation date between a willing buyer and a willing seller in an arm's length transaction, after proper marketing and where the parties had each acted knowledgeably, prudently and without compulsion"[1].
In the context of January 2026 market conditions, each element of this definition takes on heightened significance:
🔍 "On the valuation date": With rapid month-to-month improvements in market sentiment (net balance improving from -19% to -10% over three months), the specific valuation date becomes critical. Valuations conducted in early January may require different considerations than those conducted in late January.
🔍 "After proper marketing": The improved buyer enquiry levels (-15% vs -29% three months prior) suggest that properly marketed properties are now attracting more interest, potentially supporting stronger valuation positions than would have been justified in Q4 2025.
🔍 "Knowledgeably and prudently": Both parties in the current market must understand the stabilisation context—buyers should recognize improving conditions while sellers must acknowledge that recovery remains gradual and regionally varied.
Comparable Evidence Selection and Adjustment
The improved transaction data from January 2026 (agreed sales at -9%, the best reading since June 2025) provides valuers with more robust comparable evidence[1]. However, selecting and adjusting comparables in a stabilising market requires systematic rigor:
Comparable Selection Hierarchy:
- Primary comparables: Transactions from December 2025-January 2026 in the same micro-market (minimal adjustment required)
- Secondary comparables: Transactions from October-November 2025 in the same micro-market (time adjustment required)
- Tertiary comparables: Recent transactions in adjacent micro-markets with similar characteristics (location and time adjustments required)
Adjustment Framework:
When conducting a Level 3 full building survey that includes valuation advice, apply adjustments in this sequence:
| Adjustment Factor | Typical Range | Application Notes |
|---|---|---|
| Property size | ±5-15% | Per square meter/foot variance |
| Condition | ±5-20% | Critical in stabilising markets where condition premiums increase |
| Location (micro) | ±3-10% | Even within strong regions, micro-location matters |
| Time/market movement | ±1-5% | Based on regional RICS net balance trends |
| Property type/style | ±5-15% | Buyer preferences may shift during stabilisation |
Forward-Looking Valuation Considerations
The January 2026 RICS data reveals a striking divergence between short-term and long-term expectations that valuers must carefully navigate:
📊 Three-month outlook: Net balance at -4%, indicating a broadly flat near-term price trajectory[3]
📊 Twelve-month outlook: Net balance at +43%, the most positive since February 2025, suggesting significant price appreciation expectations[1]
This divergence creates specific challenges for different valuation purposes:
For mortgage lending valuations: Lenders typically focus on current market value with limited weight given to future appreciation. The flat three-month outlook suggests maintaining conservative positions, particularly in Southern regions where recovery lags.
For investment and development appraisals: The strong twelve-month outlook (+43%) and sales expectations (+35%) support more optimistic residual land valuations and development feasibility assessments, particularly in Northern regions showing current growth.
For family law and probate valuations: Where market value at a specific date is required, the stabilisation context should be clearly explained in the valuation report, noting the trajectory from October 2025 through January 2026.
Understanding the difference between Level 2 and Level 3 surveys becomes relevant here, as more comprehensive surveys provide the detailed property condition information necessary to justify valuation adjustments in a market where condition premiums may be increasing.
Practical Application: Case Studies and Scenarios

Case Study 1: Northern England Family Home
Property: 4-bedroom detached house in Greater Manchester
Valuation Date: January 2026
Purpose: Mortgage lending
Market Context: Northern England has emerged as a standout performer with consistent reports of prices moving higher[8]. The regional net balance significantly exceeds the national -10% figure.
Comparable Evidence:
- Comparable A: Similar property sold November 2025 for £425,000
- Comparable B: Similar property sold December 2025 for £432,000
- Comparable C: Similar property sold January 2026 for £438,000
Valuation Approach:
- Recognize positive regional momentum exceeding national trends
- Apply +2% time adjustment to Comparable A (November sale) = £433,500
- Apply +1% time adjustment to Comparable B (December sale) = £436,320
- Use Comparable C (January sale) with minimal adjustment = £438,000
- Weight most recent comparable heavily given improving market
- Apply minor adjustments for specific property differences
Concluded Value: £440,000 (reflecting strong regional performance and recent positive momentum)
Report Commentary: "The subject property is located in a region demonstrating positive price growth according to RICS January 2026 survey data, with Northern England emerging as a standout performer. The valuation reflects this regional strength while maintaining appropriate caution given the gradual nature of the national recovery."
Case Study 2: South East London Apartment
Property: 2-bedroom apartment in South East London
Valuation Date: January 2026
Purpose: Purchase advice
Market Context: London continues to lag behind the national average, with the South East showing modest improvement but ongoing affordability challenges[1].
Comparable Evidence:
- Comparable A: Similar property sold October 2025 for £385,000
- Comparable B: Similar property sold December 2025 for £382,000
- Comparable C: Similar property currently marketed at £395,000 (no sale agreed)
Valuation Approach:
- Recognize that London/South East recovery lags national trends
- Note that December comparable (B) sold for less than October comparable (A), suggesting continued downward pressure through Q4 2025
- Apply conservative +0.5% adjustment to December comparable to reflect modest January stabilisation = £383,910
- Discount asking price of Comparable C by typical 3-5% to reflect likely agreed price
- Weight recent transaction evidence heavily over aspirational asking prices
Concluded Value: £385,000 (reflecting cautious stabilisation in lagging region)
Report Commentary: "While national house price data shows stabilisation with the net balance improving to -10% in January 2026, London and the South East continue to lag behind this trend. The valuation adopts a measured approach reflecting the more subdued recovery in this region, with ongoing affordability constraints limiting price growth potential in the near term."
Case Study 3: Scottish Property Development Site
Property: Residential development site with planning for 8 houses
Valuation Date: January 2026
Purpose: Development appraisal and land acquisition
Market Context: Scotland demonstrates the strongest price growth nationally, with positive net balances and robust buyer demand[1].
Valuation Approach (Residual Method):
-
Gross Development Value (GDV): Apply strong regional growth assumptions
- Use recent comparable sales with +3% uplift for anticipated appreciation during 18-month development period
- Justified by +43% twelve-month price expectations and Scotland's outperformance[1]
-
Build Costs: Current construction costs with inflation allowance
-
Sales Period: Assume shorter sales period (12 months vs. 15 months) due to +35% sales expectations and strong regional demand[1]
-
Developer's Profit: Maintain standard 20% given reduced market risk in strong-performing region
-
Residual Land Value: Calculate with confidence given robust market fundamentals
Concluded Land Value: £1.2 million (reflecting strong Scottish market performance and positive development outlook)
Report Commentary: "Scotland continues to demonstrate the strongest price growth nationally according to RICS January 2026 survey data. The twelve-month price expectations net balance of +43% and sales expectations of +35% support a positive development appraisal, with reduced market risk compared to regions showing more modest recovery."
These case studies demonstrate how the Valuation Impacts of Stabilising House Prices: RICS Techniques from January 2026 Survey Data translate into practical valuation decisions that vary significantly by region, property type, and valuation purpose.
Rental Market Implications for Investment Valuations
Lettings Market Dynamics in 2026
The January 2026 RICS survey reveals critical trends in the rental market that directly impact investment property valuations. Tenant demand edged higher in the three months to January, while landlord instructions remain firmly negative, meaning supply continues to be constrained[1]. This supply-demand imbalance has significant implications for rental pricing and investment yields.
Key rental market indicators:
📈 Rising rental prices expected: The constrained supply and increasing demand combination points to continued rental price growth in the near term, supporting higher valuations for buy-to-let investments.
📈 Improved yield prospects: For investors, the combination of stabilising purchase prices and rising rents suggests improving gross and net yields, particularly in regions showing price stability or modest growth rather than rapid appreciation.
📈 Tenant retention value: In a market with limited supply, sitting tenants represent increased value, as void periods may be shorter and rental increases more achievable.
Investment Valuation Adjustments
When valuing investment properties using the investment method (capitalizing rental income), the January 2026 market conditions suggest several adjustments:
1. Rental Growth Assumptions
- Strong regions (Scotland, Northern England): Apply 4-6% annual rental growth
- National average regions: Apply 3-4% annual rental growth
- Lagging regions: Apply 2-3% annual rental growth
2. Yield Compression Potential
The stabilising house prices combined with rising rents may lead to yield compression (falling capitalization rates) as investment demand increases:
- Prime locations in strong regions: Potential for 25-50 basis point yield compression
- Secondary locations: More modest 10-25 basis point compression
- Tertiary locations in lagging regions: Limited compression potential
3. Void Period Assumptions
Given constrained supply and improving demand:
- Reduce assumed void periods by 1-2 weeks compared to 2025 assumptions
- Particularly applicable in strong rental markets like Scotland and Northern England
- Less applicable in areas with oversupply or weak employment fundamentals
For those seeking independent property valuation for investment purposes, understanding these rental market dynamics is crucial for accurate assessment of investment potential in the current stabilising environment.
Risk Factors and Valuation Uncertainties
Short-Term vs. Long-Term Outlook Divergence
One of the most significant challenges in applying the Valuation Impacts of Stabilising House Prices: RICS Techniques from January 2026 Survey Data is the marked divergence between near-term and long-term expectations:
⚠️ Three-month price expectations: Net balance at -4%, suggesting a broadly flat immediate outlook[3]
✅ Twelve-month price expectations: Net balance at +43%, indicating strong confidence in medium-term appreciation[1]
This divergence creates valuation uncertainty, particularly for:
- Mortgage lending: Where conservative near-term views may dominate
- Development appraisals: Where medium-term optimism may justify higher land values
- Portfolio valuations: Where the appropriate time horizon must be carefully considered
Economic and Policy Uncertainties
While the RICS data shows clear market stabilisation, several external factors create ongoing valuation uncertainty:
🔴 Interest rate trajectory: Future Bank of England decisions will significantly impact affordability and demand
🔴 Economic growth: UK economic performance will influence employment, income growth, and housing demand
🔴 Government policy: Potential changes to stamp duty, planning regulations, or housing policy could shift market dynamics
🔴 Regional economic performance: The divergence between Northern and Southern regions may widen or narrow based on regional economic outcomes
Chartered surveyors must acknowledge these uncertainties in valuation reports, particularly when providing advice for significant financial decisions. Understanding why building surveys are essential for home buyers becomes even more critical in uncertain markets, as property condition can significantly impact value in ways that market trends alone cannot predict.
Reporting Valuation Uncertainty
The RICS Red Book requires valuers to report any material uncertainty affecting their valuation. In the context of January 2026 market conditions, appropriate uncertainty disclosure might include:
Standard Uncertainty Clause (Stabilising Market):
"The UK residential property market is currently in a period of stabilisation following a challenging period through late 2025. While the RICS January 2026 Residential Market Survey indicates improving sentiment, with the net balance for house prices at -10% (improved from -19% in October 2025), near-term price expectations remain broadly flat. Significant regional divergence is evident, with Northern regions outperforming Southern areas. The valuation reflects current market conditions as at the valuation date, but readers should be aware that the market remains in transition and future price movements may vary from current expectations."
This level of disclosure ensures that valuation users understand the context and limitations of the valuation opinion, protecting both the surveyor and the client from misunderstandings about valuation certainty.
Technology and Data Integration in Modern Valuation Practice
Leveraging RICS Survey Data in Valuation Software
Modern chartered surveyors increasingly use valuation software and automated valuation models (AVMs) to supplement traditional valuation techniques. The RICS Techniques from January 2026 Survey Data can be integrated into these systems to improve accuracy:
Data Integration Points:
- Regional adjustment factors based on RICS net balance data
- Time-based market movement adjustments reflecting the October-January improvement trajectory
- Confidence intervals adjusted for market stabilisation vs. volatility
- Comparable weighting algorithms that prioritize recent transactions in stabilising markets
Quality Assurance Checks:
- Flag valuations in lagging regions (London, South East) that show significant appreciation from recent comparables
- Highlight valuations in strong regions (Scotland, Northern England) that fail to reflect positive momentum
- Alert valuers when comparable evidence predates significant market sentiment shifts
Combining Survey Data with Local Market Intelligence
While the RICS survey provides invaluable national and regional context, local market intelligence remains critical for accurate valuations. Chartered surveyors should combine:
✅ RICS macro data: National and regional trends, sentiment indicators, forward-looking expectations
✅ Local agent intelligence: Micro-market dynamics, buyer profiles, property-specific demand factors
✅ Transaction data: Recent sales, time on market, achieved prices vs. asking prices
✅ Economic indicators: Local employment, infrastructure investment, demographic trends
This multi-layered approach ensures that valuations reflect both the broader market context revealed by the Valuation Impacts of Stabilising House Prices: RICS Techniques from January 2026 Survey Data and the specific characteristics of the individual property and its immediate market.
For surveyors conducting comprehensive building surveys, integrating market data with detailed property condition assessment provides clients with the most complete picture of both property value and risk.
Conclusion: Navigating Stabilisation with Precision and Confidence
The Valuation Impacts of Stabilising House Prices: RICS Techniques from January 2026 Survey Data reveal a UK residential property market at a critical inflection point. After months of declining confidence and negative sentiment, the improvement in the net balance from -19% in October 2025 to -10% in January 2026 marks a decisive trend reversal that chartered surveyors must understand and apply in their valuation practice[1].
However, this stabilisation is not uniform. The pronounced regional divergence—with Scotland, Northern Ireland, and Northern England showing positive growth while London and the South East continue to lag—demands that valuation professionals adopt differentiated approaches based on specific market contexts rather than relying on national averages alone[1][8].
Key Principles for Valuation Practice in 2026
1. Embrace Regional Differentiation
Apply positive adjustments in strong-performing regions while maintaining conservative positions in lagging markets. The one-size-fits-all approach is no longer appropriate in the current divergent market.
2. Weight Recent Evidence Heavily
Given the rapid improvement in market sentiment over the past three months, recent comparable transactions (December 2025-January 2026) should be weighted more heavily than older evidence, with appropriate time adjustments applied to earlier sales.
3. Balance Short-Term Caution with Medium-Term Optimism
The flat three-month outlook (-4%) suggests near-term caution, while the strong twelve-month expectations (+43%) support more optimistic medium-term projections[1][3]. Match your valuation approach to the specific purpose and time horizon.
4. Acknowledge Uncertainty Transparently
The market remains in transition. Clear disclosure of uncertainty and the factors influencing your valuation opinion protects both you and your clients while maintaining professional standards.
5. Integrate Multiple Data Sources
Combine RICS survey data with local market intelligence, transaction evidence, and economic indicators to develop a comprehensive market understanding that informs accurate valuations.
Actionable Next Steps for Chartered Surveyors
📋 Review your regional adjustment matrices: Update your valuation templates to reflect the current regional divergence, with specific adjustment factors for Northern vs. Southern markets.
📋 Audit recent valuations: Review valuations conducted in Q4 2025 to assess whether updated market conditions warrant revised opinions, particularly for properties in strong-performing regions.
📋 Enhance comparable evidence databases: Prioritize gathering recent transaction data from December 2025-January 2026, as this evidence reflects the stabilised market conditions.
📋 Update client communications: Ensure valuation reports clearly explain the stabilisation context and regional variations, helping clients understand the market dynamics affecting their property values.
📋 Invest in continuing professional development: Stay current with RICS guidance and market data by regularly reviewing monthly survey releases and attending relevant CPD events focused on valuation in transitional markets.
The stabilisation of UK house prices in early 2026 represents an opportunity for chartered surveyors to demonstrate their professional value through nuanced, evidence-based valuation opinions that reflect the complex reality of regional divergence and gradual recovery. By applying the RICS Techniques from January 2026 Survey Data with precision and professional judgment, valuers can provide the accurate, reliable advice that clients need to make informed property decisions in this evolving market landscape.
For comprehensive property assessment services that integrate market valuation with detailed condition surveys, explore our full range of surveying services designed to support informed property decisions in 2026's stabilising market.
References
[1] Uk Resi Survey Jan 2026 Report Shows Early Signs Market Recovery Despite Caution – https://www.rics.org/news-insights/uk-resi-survey-jan-2026-report-shows-early-signs-market-recovery-despite-caution
[2] Uk Rics Residential Market Survey Jan 2026 – https://www.capitaleconomics.com/publications/uk-housing-market-update/uk-rics-residential-market-survey-jan-2026
[3] Uk Residential Market Survey January 2026 – https://www.rics.org/content/dam/ricsglobal/documents/market-surveys/uk-residential-market-survey/UK-Residential-Market-Survey_January-2026.pdf
[4] Market View January 2026 – https://www.watsons-property.co.uk/market-view-january-2026/
[5] Uk Residential Market Survey February 2026 – https://www.rics.org/content/dam/ricsglobal/documents/market-surveys/uk-residential-market-survey/UK-Residential-Market-Survey_February-2026.pdf
[6] Uk Residential Survey Dec 2025 Confidence Rebound – https://www.rics.org/news-insights/uk-residential-survey-dec-2025-confidence-rebound
[7] 1383536 Uk Residential Market Survey January 2026 – https://www.forexfactory.com/news/1383536-uk-residential-market-survey-january-2026
[8] Rics Residential Market Survey Q1 2026 Building Survey Implications For Northern England Price Surges 2 – https://nottinghillsurveyors.com/blog/rics-residential-market-survey-q1-2026-building-survey-implications-for-northern-england-price-surges-2