Imagine standing on an empty plot of land, trying to visualize underground utilities, zoning restrictions, property boundaries, and environmental constraints—all at once. For decades, surveyors juggled multiple paper maps, spreadsheets, and disconnected data sources to piece together this complex puzzle. Today, Geographic Information Systems (GIS) have transformed this chaotic process into a streamlined, visual experience that revolutionizes how professionals approach land development projects.
GIS Integration in Property Surveying: Enhancing Data Visualization and Decision-Making for Land Development represents a fundamental shift in how surveying professionals collect, analyze, and present spatial data. By overlaying multiple data layers—from zoning regulations to utility networks—onto a single interactive map, surveyors can now identify conflicts, optimize designs, and communicate findings with unprecedented clarity. This technological evolution isn't just about better maps; it's about making smarter, faster, and more informed decisions that save time, reduce costs, and minimize risks throughout the development lifecycle.
As we move through 2026, the integration of GIS technology with advanced surveying methods has become essential for competitive land development practices. The recent updates to the ALTA/NSPS 2026 Standards, which became effective on February 23, 2026, emphasize enhanced precision requirements and clearer documentation[1]—standards that GIS platforms are uniquely positioned to meet and exceed.
Key Takeaways
- GIS integration transforms property surveying by combining multiple data layers (zoning, boundaries, utilities, topography) into single, interactive visualizations that reveal spatial relationships invisible in traditional survey methods
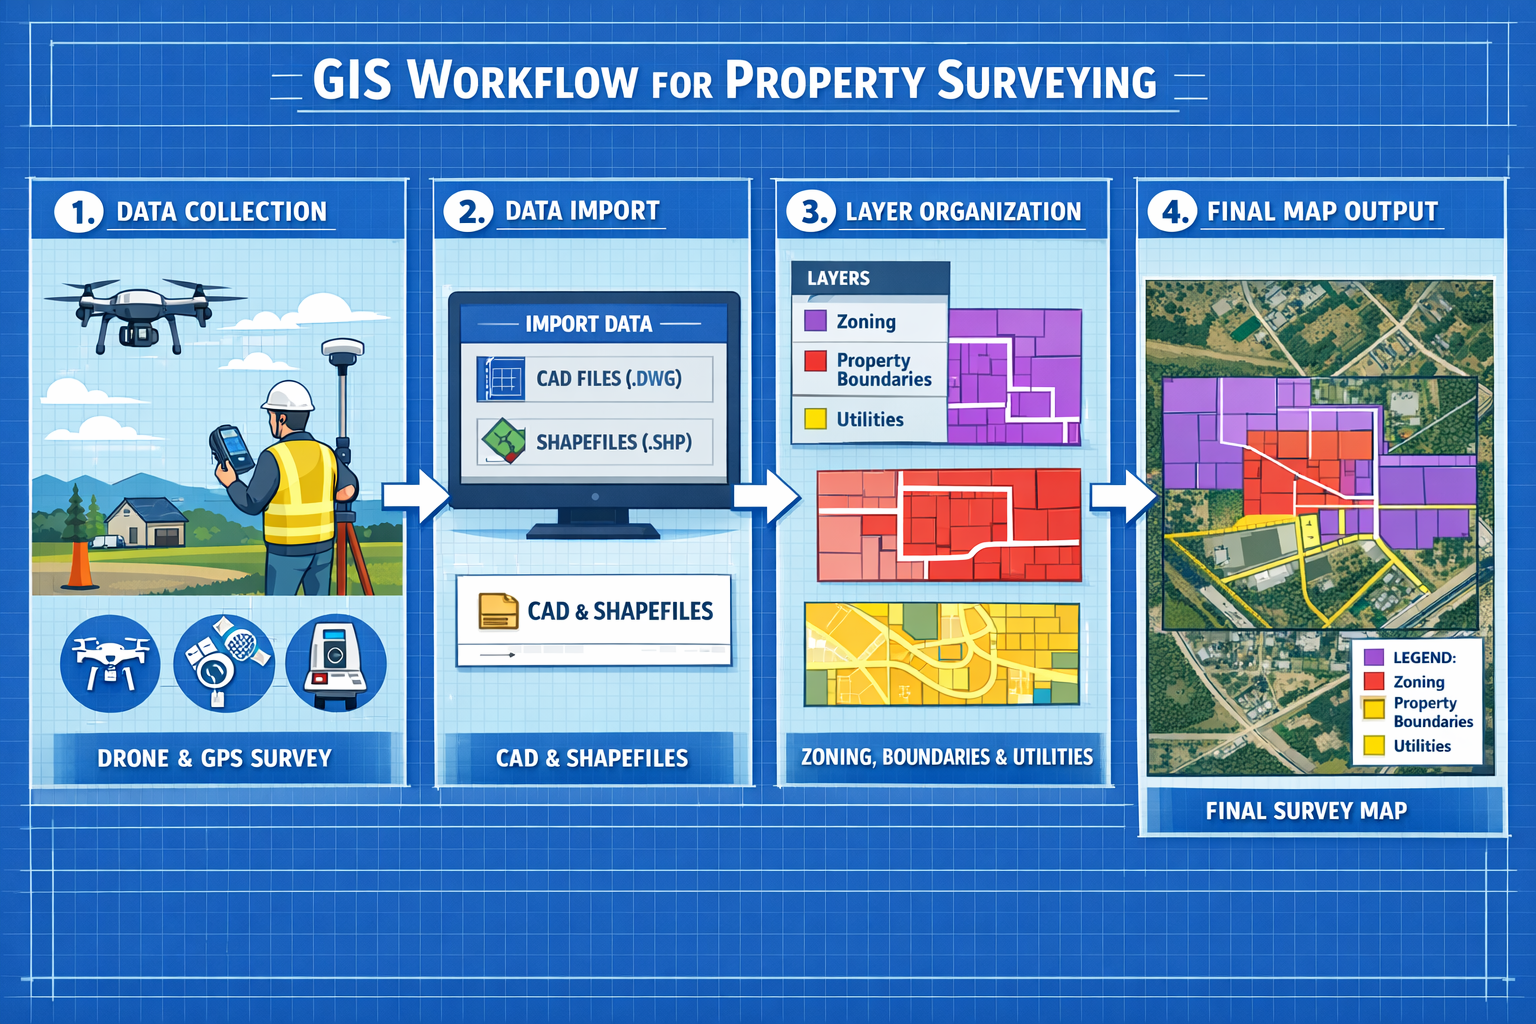
- Step-by-step GIS setup involves data collection, importing multiple formats, organizing layers strategically, and applying analysis tools to identify conflicts and opportunities before construction begins
- Enhanced decision-making occurs through real-time collaboration, 3D modeling, and AI-powered trend analysis that predict development challenges and optimize site planning
- The 2026 ALTA/NSPS standards now require enhanced utility documentation and improved transparency[1], making GIS integration more valuable than ever for compliance and accuracy
- Cloud-based GIS platforms enable instant sharing, real-time updates, and cross-team collaboration that accelerates project timelines and reduces costly errors
Understanding GIS Integration in Modern Property Surveying
What Is GIS and Why Does It Matter for Surveying?
Geographic Information Systems (GIS) are powerful software platforms that capture, store, analyze, and display spatial data tied to specific locations on Earth. Unlike traditional surveying tools that produce static measurements and drawings, GIS creates dynamic, interactive maps where every element contains detailed information accessible with a simple click.
For property surveyors, GIS integration means combining traditional surveying accuracy with modern data visualization capabilities. When conducting a full building survey, surveyors can now overlay their precise measurements with:
- 📍 Property boundaries with legal descriptions
- 🏗️ Zoning classifications and development restrictions
- 🔧 Utility infrastructure (water, gas, electric, sewer)
- 🌳 Environmental constraints (wetlands, flood zones, protected areas)
- 📊 Topographic data showing elevation changes
- 🏘️ Adjacent property information and easements
This layered approach transforms raw survey data into actionable intelligence. Instead of reviewing dozens of separate documents, stakeholders can view all relevant information simultaneously, understanding how different factors interact and influence development potential.
The Evolution from Traditional to GIS-Enhanced Surveying
Traditional property surveying relied heavily on manual measurements, paper maps, and isolated data sets. A surveyor would visit a site, take measurements with a theodolite or total station, return to the office, and manually draft plans. If zoning information was needed, it required a separate visit to municipal offices. Utility locations might come from yet another source, often with questionable accuracy.
GIS integration has revolutionized this workflow by centralizing all spatial data in one accessible platform. Modern surveyors now use GNSS/GPS technology that provides real-time data with centimeter-level accuracy[2], instantly uploading measurements to cloud-based GIS platforms where they automatically align with existing data layers.
The introduction of AI embedded in core surveying workflows[2] has further accelerated this transformation. AI systems now automatically classify terrain features, identify boundary markers, flag potential anomalies, and generate preliminary surface models—tasks that previously consumed hours of manual processing time[2]. This automation allows surveyors to focus on expertise-driven analysis rather than data entry.
"AI is now directly integrated into surveying operations rather than serving as a peripheral tool, with systems automatically classifying terrain, identifying markers, and flagging anomalies."[2]
Key Benefits of GIS Integration in Property Surveying
The advantages of incorporating GIS into property surveying workflows extend far beyond prettier maps. Here are the transformative benefits:
Enhanced Visualization and Communication 📊
GIS maps communicate complex spatial relationships instantly. Stakeholders who might struggle to interpret technical survey drawings can immediately understand color-coded zoning maps, 3D terrain models, and layered utility networks. This clarity reduces misunderstandings and accelerates approval processes.
Improved Accuracy and Conflict Detection ✅
By overlaying multiple data sources, GIS reveals conflicts that might otherwise go unnoticed until construction begins. For example, a proposed building footprint might inadvertently overlap with an underground utility easement or violate setback requirements—issues GIS identifies immediately through spatial analysis.
Time and Cost Savings ⏱️💰
What once required multiple site visits, manual calculations, and coordination across departments now happens in minutes. Cloud-based GIS platforms enable instant file sharing and real-time revision syncing[2], eliminating version control issues and reducing project delays.
Better Regulatory Compliance 📋
The 2026 ALTA/NSPS standards now specify that utility poles within 10 feet of property and other utility features within 5 feet must be identified and located[1]. GIS platforms excel at documenting and displaying this information with the precision and clarity regulators require.
Data-Driven Decision Making 🎯
GIS doesn't just display data—it analyzes it. Surveyors can perform buffer analyses to ensure compliance with setback requirements, slope analyses to identify drainage issues, and viewshed analyses to understand visual impacts. These analytical capabilities transform surveying from documentation to strategic planning.
Step-by-Step Guide to Setting Up GIS for Property Surveying Projects
Phase 1: Data Collection and Preparation
The foundation of effective GIS integration begins with comprehensive data collection. Modern surveying projects leverage multiple data sources to build complete spatial datasets:
Field Survey Data Collection 🛰️
Start with precise ground measurements using GNSS/GPS equipment that provides centimeter-level accuracy[2]. Modern total stations and robotic surveying instruments automatically record measurements with coordinate information that imports directly into GIS platforms.
For larger sites, consider multi-sensor drone deployment[2]. Today's autonomous drone systems carry synchronized sensor arrays including LiDAR, photogrammetry cameras, multispectral sensors, and thermal imaging units operating simultaneously[2]. These systems capture in a single flight what previously required multiple site visits, dramatically reducing data collection time.
Public Records and Existing Data 📚
Gather existing spatial data from multiple sources:
- Municipal GIS databases (often publicly accessible online)
- County assessor's parcel data
- Utility company infrastructure maps
- FEMA flood zone maps
- Environmental protection agency wetland delineations
- Historical survey plats and legal descriptions
- Topographic maps from geological surveys
Data Format Verification 🔍
Ensure all collected data is in compatible formats. Common GIS-compatible formats include:
- Shapefiles (.shp) – industry standard vector format
- GeoJSON – web-friendly spatial data format
- KML/KMZ – Google Earth compatible files
- CAD files (.dwg, .dxf) – often require conversion
- Raster imagery (.tif, .jpg with georeference)
- LiDAR point clouds (.las, .laz)
When conducting drone surveys, ensure the output includes both high-resolution imagery and accurate georeferencing information that allows seamless integration with other GIS layers.
Phase 2: Importing and Organizing Data Layers
Once data is collected, the next critical step involves importing and structuring it within your GIS platform. Proper organization determines how effectively you can analyze and visualize information.
Establishing a Coordinate Reference System 🌐
All spatial data must share a common coordinate reference system (CRS) to align properly. For property surveying in specific regions, use local state plane coordinate systems that provide the highest accuracy for smaller areas. Ensure all imported layers are projected to the same CRS to prevent misalignment issues.
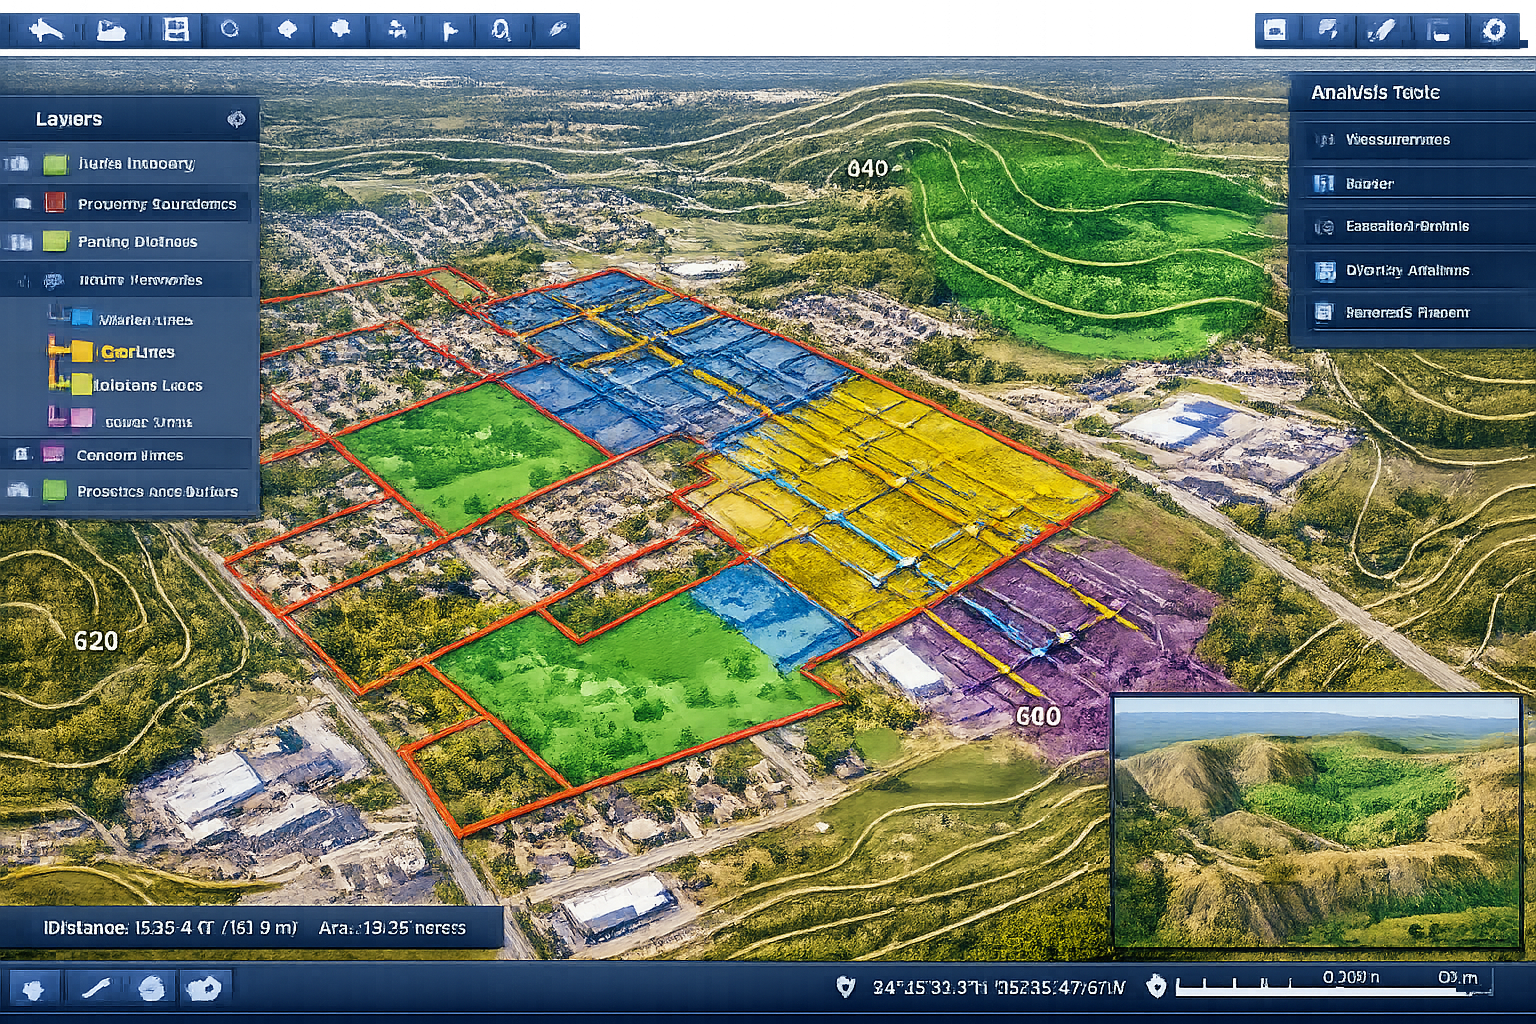
Creating a Logical Layer Hierarchy 📚
Organize data layers in a logical order that facilitates analysis and presentation:
| Layer Priority | Data Type | Color Coding | Purpose |
|---|---|---|---|
| 1 (Top) | Property Boundaries | Bold Red | Primary survey focus |
| 2 | Zoning Districts | Transparent Purple | Regulatory context |
| 3 | Utility Networks | Yellow/Orange | Infrastructure conflicts |
| 4 | Topography/Contours | Brown | Elevation analysis |
| 5 | Environmental Constraints | Green | Protected areas |
| 6 (Base) | Aerial Imagery | Natural Colors | Visual reference |
Attribute Data Enhancement 📝
Each spatial feature should include comprehensive attribute data:
- Property boundaries: legal descriptions, ownership, deed references
- Utilities: type, size, depth, installation date, owner
- Zoning: classification codes, permitted uses, restrictions
- Topography: elevation values, slope percentages
This attribute information becomes searchable and can drive analytical queries. For example, you might query "show all water mains larger than 12 inches within 50 feet of the proposed building footprint."
Quality Control and Validation ✓
Before proceeding to analysis, validate your data:
- Check for spatial gaps or overlaps in boundary data
- Verify attribute completeness
- Confirm coordinate system consistency
- Test layer visibility at different zoom levels
- Validate topology (ensure boundaries connect properly)
This quality control step prevents errors from propagating through subsequent analysis phases.
Phase 3: Applying GIS Analysis Tools for Land Development
With data properly organized, GIS platforms offer powerful analytical tools that transform static information into development insights.
Buffer Analysis for Setback Compliance 📏
Create buffer zones around property boundaries to visualize required setbacks. For example, if zoning requires a 25-foot front setback, generate a 25-foot buffer polygon from the front property line. Any proposed structures overlapping this buffer violate setback requirements—an issue identified instantly rather than discovered during permit review.
Similarly, create buffers around utilities, wetlands, or other constraints to identify development-free zones. The 2026 ALTA/NSPS standards require enhanced utility documentation[1], making these buffer analyses essential for compliance verification.
Overlay Analysis for Conflict Detection ⚠️
Overlay analysis identifies where different data layers intersect, revealing potential conflicts:
- Proposed building footprints overlapping utility easements
- Driveways crossing protected wetland buffers
- Construction staging areas within flood zones
- Access roads conflicting with neighboring property rights
When planning property renovations, overlay analysis helps identify which improvements face regulatory or physical constraints before design work begins.
Slope and Aspect Analysis ⛰️
Terrain analysis reveals critical development considerations:
- Slope analysis identifies areas too steep for construction or requiring retaining walls
- Aspect analysis shows which areas receive optimal solar exposure
- Viewshed analysis determines visual impacts on neighboring properties
- Cut-and-fill calculations estimate earthwork volumes and costs
These analyses inform site planning decisions, helping developers position buildings to minimize grading costs while maximizing desirable site characteristics.
Network Analysis for Utility Connectivity 🔌
GIS network analysis tools trace utility connections, identifying:
- Shortest routes for new utility connections
- Service areas for existing infrastructure
- Capacity constraints in existing networks
- Alternative routing options when primary routes are blocked
This capability proves invaluable when coordinating with utility providers during development planning.
Spatial Statistics and Trend Analysis 📈
Advanced GIS platforms perform statistical analyses on spatial data:
- Hot spot analysis identifies areas with clustering of specific features
- Density analysis shows concentration patterns (e.g., utility pole density)
- Proximity analysis measures distances to important features
- Change detection compares historical imagery to identify land use changes
These analytical capabilities support data-driven decision-making, helping developers understand site context within broader regional patterns.
Enhancing Decision-Making Through GIS-Powered Data Visualization
Creating Compelling Visual Presentations for Stakeholders
One of GIS's most powerful contributions to property surveying is transforming technical data into compelling visual narratives that stakeholders immediately understand. This communication enhancement accelerates approvals and builds consensus.
Interactive Web Maps 🌐
Modern GIS platforms generate interactive web maps that stakeholders access through standard browsers without specialized software. These maps allow:
- Zooming and panning to explore site details
- Toggling layers on/off to focus on specific information
- Clicking features to view detailed attribute data
- Measuring distances and areas directly on the map
- Comparing different development scenarios side-by-side
When presenting findings from a Level 3 building survey, interactive maps help clients understand spatial relationships between identified issues and proposed remediation strategies.
3D Visualization and Digital Twins 🏗️
Real-time 3D digital twin technology[2] creates high-fidelity, interactive 3D models that update continuously as new data is collected. These digital twins enable visualization of land behavior under various conditions including:
- Slope erosion projections
- Water flow simulations during storm events
- Vegetation pattern changes over seasons
- Infrastructure stress testing under different loads
Survey firms increasingly provide these digital-twin deliverables to commercial development clients[2], offering immersive experiences that static 2D maps cannot match. Stakeholders can virtually "walk through" proposed developments, understanding spatial relationships and visual impacts before construction begins.
Before-and-After Scenario Modeling 🔄
GIS excels at scenario comparison, allowing developers to visualize different design alternatives:
- Multiple building placement options with associated impacts
- Alternative access road configurations
- Different stormwater management approaches
- Phased development sequences
By visualizing each scenario's implications for utilities, drainage, traffic, and aesthetics, decision-makers can compare options objectively and select the approach that best balances competing priorities.
Real-Time Collaboration and Cloud-Based Workflows
The shift to cloud-based platform standardization[2] has fundamentally changed how surveying teams collaborate with clients, engineers, architects, and regulatory agencies.
Instant Data Sharing and Access ☁️
Cloud platforms enable instant file sharing, 3D visualization in-browser, real-time revision syncing, and integrated communication between surveyors, engineers, and architects[2]. Static document delivery has transitioned to interactive, collaborative digital environments[2].
This transformation proves particularly valuable when coordinating with multiple stakeholders. For example, when preparing condition survey reports, cloud-based GIS allows building owners, facility managers, and contractors to simultaneously review findings, add comments, and track remediation progress—all within the same platform.
Version Control and Audit Trails 📋
Cloud-based GIS platforms automatically track changes, maintaining complete audit trails showing:
- Who made each modification
- When changes occurred
- What data was altered
- Previous versions for comparison
This version control eliminates confusion about which dataset represents the current state, preventing costly errors from outdated information.
Cross-Discipline Integration 🤝
GIS serves as a common visual language across project teams. Building Information Modeling (BIM) integration[2] allows land surveyors to collaborate with architects, engineers, and construction professionals, integrating geospatial data into BIM models to enhance project planning, reduce design conflicts, and improve construction efficiency[2].
When site survey data feeds directly into architectural BIM models, designers immediately see how terrain, utilities, and constraints affect building placement and design. This integration identifies conflicts during planning rather than construction, when changes cost exponentially more.
AI-Powered Insights and Predictive Analysis
Artificial intelligence has moved from peripheral tool to core component of GIS-enhanced surveying workflows, providing insights that manual analysis would miss.
Automated Feature Detection and Classification 🤖
AI systems analyze imagery and point cloud data to automatically identify and classify:
- Building footprints and roof structures
- Vegetation types and canopy coverage
- Pavement conditions and surface types
- Utility features (poles, manholes, transformers)
- Terrain features (slopes, drainage patterns)
This automation dramatically reduces the time required to create comprehensive site inventories. What once took days of manual digitizing now happens in hours, with AI flagging uncertain classifications for human review.
Anomaly Detection and Risk Identification ⚠️
AI algorithms identify patterns that suggest potential issues:
- Unusual elevation changes indicating possible sinkholes
- Vegetation stress patterns suggesting underground water leaks
- Thermal signatures revealing heat loss or moisture problems
- Historical imagery changes showing unauthorized encroachments
These early warnings allow proactive investigation before minor issues become major problems, particularly valuable when conducting building materials assessments.
Predictive Modeling for Development Planning 📊
Machine learning algorithms analyze historical data to predict future conditions:
- Flood risk based on terrain, soil types, and historical weather patterns
- Traffic impacts from proposed developments using regional transportation models
- Property value changes from different development scenarios
- Environmental impacts on sensitive ecosystems
These predictive capabilities inform decision-making with evidence-based forecasts rather than guesswork, helping developers anticipate and mitigate potential issues before they materialize.
Trend Analysis for Market Intelligence 📈
GIS-based trend analysis reveals patterns across time and space:
- Land use changes indicating development pressure
- Property value trends by location and characteristics
- Permit activity showing where development is concentrating
- Infrastructure capacity constraints limiting future growth
This market intelligence helps developers identify opportunities and avoid areas with emerging constraints, informing strategic land acquisition decisions.
Practical Applications: GIS Integration Across Development Phases
Pre-Acquisition Due Diligence
Before purchasing land for development, comprehensive due diligence identifies opportunities and risks. GIS integration transforms this process from document review to spatial analysis.
Site Suitability Analysis 🎯
GIS enables multi-criteria evaluation, scoring potential sites based on:
- Proximity to utilities and infrastructure
- Zoning compatibility with intended use
- Environmental constraints (wetlands, endangered species habitat)
- Topographic suitability (slope, drainage)
- Access to transportation networks
- Distance from competing developments
By weighting these factors according to project priorities, GIS generates suitability maps highlighting the most promising locations, focusing acquisition efforts on properties with highest development potential.
Comparative Site Analysis ⚖️
When evaluating multiple potential properties, GIS provides objective comparison frameworks. Create standardized analysis templates that evaluate each site using identical criteria, generating comparison matrices showing how properties rank across key factors.
This systematic approach removes guesswork from site selection, supporting investment decisions with quantifiable data. When considering properties requiring areas of further investigation, GIS helps prioritize which issues warrant detailed analysis versus which represent deal-breakers.
Historical Context and Change Detection 📅
GIS platforms integrate historical aerial imagery, revealing how sites have changed over decades. This temporal analysis identifies:
- Previous land uses that might indicate contamination
- Unauthorized structures or encroachments
- Natural hazard patterns (flooding, erosion)
- Vegetation changes suggesting drainage issues
Understanding site history prevents costly surprises during development, particularly when historical uses might trigger environmental remediation requirements.
Design and Planning Phase
Once a site is acquired, GIS supports the design and planning process by providing the spatial intelligence designers need to create optimal, compliant plans.
Constraint Mapping and Buildable Area Identification 🗺️
Create comprehensive constraint maps that overlay all development limitations:
- Required setbacks from property boundaries
- Utility easements prohibiting structures
- Environmental buffers around wetlands and streams
- Slope limitations restricting construction
- View corridor protections
- Height restrictions from zoning or aviation regulations
The remaining area represents the buildable envelope—the space where structures can legally be placed. This visualization immediately shows designers where they have flexibility versus where constraints dictate design.
Optimal Building Placement 🏢
Within the buildable envelope, GIS analysis identifies optimal building locations considering:
- Solar orientation for energy efficiency
- Views and visual privacy
- Drainage patterns and stormwater management
- Access and circulation efficiency
- Utility connection costs
- Construction staging areas
By analyzing these factors simultaneously, GIS helps designers position buildings to maximize benefits while minimizing costs and impacts.
Infrastructure Planning and Cost Estimation 💰
GIS network analysis tools determine optimal routes for:
- Access roads and driveways
- Utility connections (water, sewer, electric, gas)
- Stormwater management systems
- Pedestrian pathways and trails
For each route option, GIS calculates distances, estimates earthwork volumes, and identifies obstacles requiring special construction techniques. This analysis supports accurate cost estimation during the planning phase, preventing budget overruns from unexpected infrastructure challenges.
When planning budgeting for repairs and restoration, GIS-based quantity takeoffs provide more accurate estimates than traditional methods.
Permitting and Regulatory Compliance
Navigating the permitting process requires demonstrating compliance with numerous regulations. GIS provides the documentation and analysis regulators require.
Automated Compliance Checking ✅
Configure GIS to automatically verify compliance with regulatory requirements:
- Setback compliance (buildings outside required buffer zones)
- Lot coverage limits (impervious surface percentages)
- Parking space requirements (count and dimensions)
- ADA accessibility (slopes, clearances, routes)
- Fire access (emergency vehicle turning radii, hydrant spacing)
Automated compliance checking identifies violations before submitting permit applications, preventing costly resubmissions and delays. The 2026 ALTA/NSPS standards emphasize clearer documentation and improved transparency[1]—qualities that GIS-generated compliance reports inherently provide.
Generating Regulatory Submittals 📄
GIS platforms generate the maps, exhibits, and documentation required for permit applications:
- Site plans showing existing and proposed conditions
- Grading and drainage plans with contours and flow arrows
- Utility plans showing connections and routing
- Landscape plans with species, quantities, and locations
- Phasing plans showing construction sequences
These submittals maintain consistency because they derive from the same underlying GIS database, eliminating discrepancies between different plan sheets that often trigger regulatory questions.
Public Engagement and Transparency 👥
Many jurisdictions now require public notification and engagement for development projects. GIS-based web maps provide accessible platforms for community review:
- Interactive maps showing project details
- Comment tools allowing public feedback
- Comparison views showing existing versus proposed conditions
- Impact analyses (traffic, visual, environmental)
This transparency builds community support and identifies concerns early when design modifications are still feasible and affordable.
Construction Phase Support
GIS continues providing value during construction, supporting quality control, progress tracking, and stakeholder communication.
Construction Staking and Layout 📍
Export GIS data to construction-grade GPS/GNSS equipment for precise field staking. Contractors use this data to:
- Mark building corners and foundation locations
- Stake utility trenches and connection points
- Establish grade elevations for earthwork
- Layout hardscape features (roads, parking, sidewalks)
This digital workflow eliminates transcription errors from paper plans to field measurements, improving accuracy and reducing rework.
Progress Monitoring and Documentation 📸
Reality capture integration[3] allows surveyors to document conditions, visually track progress, and enable real-time stakeholder collaboration. Regular drone flights create time-stamped 3D models showing construction progress, which can be compared against planned schedules to identify delays.
This visual documentation also provides valuable records for:
- Verifying contractor work completion
- Documenting pre-existing conditions before damage claims
- Creating as-built records for facility management
- Supporting change order negotiations with visual evidence
Quality Control and Inspection Support 🔍
GIS supports quality control by providing inspectors with:
- Approved plan overlays on current site conditions
- Checklists tied to specific locations
- Photo documentation linked to map features
- Deficiency tracking with status updates
Mobile GIS applications allow field inspectors to work offline, collecting data that automatically syncs to the central database when connectivity returns.
Post-Construction Asset Management
After construction completes, GIS transitions from project planning tool to long-term asset management platform.
As-Built Documentation 📐
Create comprehensive as-built GIS databases documenting:
- Final building locations and dimensions
- Actual utility routing and connection points
- Installed equipment with specifications
- Landscape features and plant materials
- Pavement and hardscape extents
This documentation provides the foundation for facility management, maintenance planning, and future modifications. GIS-centric asset lifecycle management[3] allows municipalities, state agencies, and private asset owners to leverage surveying data within comprehensive asset lifecycle management systems.
Maintenance Planning and Scheduling 🔧
Link maintenance requirements to spatial features:
- Landscape irrigation zones with watering schedules
- Pavement sections with resurfacing cycles
- Building systems with inspection frequencies
- Utility infrastructure with replacement timelines
GIS-based maintenance management systems generate work orders automatically, route field crews efficiently, and track completion status spatially.
Future Expansion Planning 🚀
When sites require expansion or modification, existing GIS databases provide the starting point for new projects. Historical data shows:
- Available capacity in existing utilities
- Locations of underground infrastructure to avoid
- Previous construction challenges and solutions
- Environmental monitoring results over time
This institutional knowledge prevents repeating past mistakes and accelerates future project planning.
Overcoming Common Challenges in GIS Integration
Data Quality and Compatibility Issues
The most frequent obstacle to successful GIS integration involves inconsistent, incomplete, or incompatible data from multiple sources.
Addressing Data Gaps 🔍
Public GIS databases often contain gaps or outdated information. When municipal data shows utilities "approximately" located, field verification becomes essential. Use subsurface utility engineering (SUE) techniques—ground-penetrating radar, electromagnetic locators, vacuum excavation—to verify critical infrastructure locations before relying on database information for design decisions.
Document data quality in your GIS database using confidence attributes:
- High confidence: Field-verified with survey-grade GPS
- Medium confidence: Verified visually but not surveyed
- Low confidence: Derived from public databases without verification
This transparency helps stakeholders understand which information is reliable versus which requires additional investigation.
Format Conversion Challenges 🔄
Data arrives in various formats requiring conversion. CAD files from architects, spreadsheets from assessors, PDFs from utility companies—each requires different handling:
- CAD files often lack proper georeferencing and require coordinate transformation
- Spreadsheet data needs geocoding to convert addresses into coordinates
- PDF maps require georeferencing and manual digitizing
Invest in format conversion tools and develop standardized workflows for common conversions. Document conversion processes to ensure consistency when multiple team members handle data imports.
Coordinate System Confusion 🌐
Different data sources often use different coordinate systems. Mixing data without proper transformation creates misalignment that can go unnoticed until construction reveals the error.
Establish project-wide coordinate system standards at project initiation. Document this standard in project specifications and verify that all data imports are properly transformed. Use GIS tools to validate alignment by overlaying data on high-resolution aerial imagery—obvious misalignments become immediately apparent.
Technical Skills and Training Requirements
GIS platforms offer powerful capabilities but require training to use effectively. Organizations face challenges building GIS competency within surveying teams.
Structured Training Programs 📚
Implement progressive training that builds skills systematically:
- Basic level: Data import, layer management, simple visualization
- Intermediate level: Spatial analysis, attribute queries, map production
- Advanced level: Automation, scripting, custom applications
Partner with GIS software vendors who offer certification programs, online courses, and user conferences. Many vendors provide industry-specific training modules tailored to surveying and land development applications.
Mentorship and Knowledge Sharing 👨🏫
Pair experienced GIS users with newcomers for hands-on learning. Create internal knowledge bases documenting:
- Standard workflows for common tasks
- Solutions to previously encountered problems
- Template projects with pre-configured settings
- Contact information for technical support resources
Regular team meetings to share tips, discuss challenges, and demonstrate new techniques accelerate skill development across the organization.
Balancing Specialization and Broad Competency ⚖️
Decide whether to develop GIS specialists or train all surveyors in GIS basics. Larger organizations often benefit from dedicated GIS specialists who support multiple project teams, while smaller firms need broader competency across all staff.
Hybrid approaches work well: train everyone in basic GIS operations while developing advanced specialists for complex analyses and custom application development.
Technology Investment and ROI Justification
GIS implementation requires significant investment in software, hardware, training, and data. Justifying this investment requires demonstrating tangible returns.
Calculating Direct Cost Savings 💰
Quantify time savings from GIS automation:
- Hours saved in data processing and map production
- Reduced site visits through remote analysis
- Faster permit approvals from better documentation
- Fewer change orders from improved conflict detection
Multiply time savings by hourly billing rates to calculate direct financial benefits. Most organizations find that GIS investments pay for themselves within 12-24 months through efficiency gains alone.
Measuring Competitive Advantages 🏆
Beyond direct savings, GIS provides competitive advantages:
- Winning projects through superior proposal presentations
- Commanding premium fees for enhanced deliverables
- Expanding service offerings (3D modeling, digital twins)
- Attracting larger clients requiring advanced capabilities
These strategic benefits may exceed direct cost savings but prove harder to quantify. Track proposal win rates, average project fees, and client retention before and after GIS implementation to demonstrate these impacts.
Phased Implementation Approaches 📊
Reduce upfront investment through phased implementation:
- Phase 1: Core GIS platform with basic analysis tools
- Phase 2: Mobile data collection applications
- Phase 3: Advanced 3D visualization and modeling
- Phase 4: Custom application development and automation
This approach spreads costs over time while delivering incremental benefits that fund subsequent phases.
Future Trends: The Evolution of GIS in Property Surveying
Augmented Reality and Field Visualization
Augmented reality (AR) technology overlays digital GIS data onto real-world views through smartphones, tablets, or specialized glasses. Surveyors can point devices at the ground and see underground utilities, property boundaries, or proposed structures superimposed on the actual site.
This technology transforms how field crews work:
- Utility locators see pipe routes before excavating
- Inspectors verify as-built conditions against approved plans
- Clients visualize proposed buildings in actual site context
- Contractors preview underground conflicts before trenching
As AR devices become more affordable and accurate, this technology will transition from novelty to standard surveying tool within the next few years.
Autonomous Data Collection Systems
The multi-sensor drone deployment[2] capabilities available in 2026 represent just the beginning of autonomous data collection. Future systems will:
- Automatically schedule and execute regular site monitoring flights
- Deploy ground-based robots for detailed inspection of structures
- Coordinate multiple autonomous platforms simultaneously
- Process data in real-time during collection, flagging issues immediately
These autonomous systems will dramatically reduce the cost and time required for comprehensive site documentation, making frequent monitoring economically feasible for projects of all sizes.
Artificial Intelligence and Machine Learning Advancement
AI capabilities in GIS will continue expanding beyond current applications:
- Generative design AI will propose optimal site layouts based on constraints and objectives
- Predictive maintenance AI will forecast infrastructure failures before they occur
- Natural language interfaces will allow non-technical users to query GIS databases conversationally
- Computer vision will automatically extract detailed information from imagery without human digitizing
These advancements will make GIS insights accessible to broader audiences while allowing specialists to tackle increasingly complex analyses.
Integration with Smart City Initiatives
As municipalities develop smart city infrastructure with networked sensors and real-time monitoring, surveying data will feed into and draw from these systems:
- Real-time traffic data informing development impact analyses
- Environmental sensor networks providing continuous monitoring data
- Building automation systems reporting energy performance
- Public infrastructure sensors detecting maintenance needs
Surveyors will increasingly work with dynamic, continuously updating data rather than static snapshots, enabling more responsive and adaptive development planning.
Conclusion: Embracing GIS Integration for Competitive Advantage

GIS Integration in Property Surveying: Enhancing Data Visualization and Decision-Making for Land Development has evolved from optional enhancement to essential capability in 2026. The convergence of advanced surveying technology, cloud-based collaboration platforms, AI-powered analysis, and increasingly stringent regulatory requirements—exemplified by the 2026 ALTA/NSPS standards[1]—makes GIS integration indispensable for competitive surveying practices.
The benefits extend across the entire development lifecycle, from pre-acquisition due diligence through long-term asset management. By overlaying zoning boundaries, property lines, utility networks, environmental constraints, and topographic data onto unified, interactive maps, GIS reveals spatial relationships and potential conflicts that traditional methods miss. This enhanced visibility enables faster, more informed decision-making that reduces risks, controls costs, and improves project outcomes.
Actionable Next Steps
For surveying professionals and development organizations ready to enhance their GIS capabilities, consider these concrete actions:
1. Assess Current Capabilities 🔍
Evaluate your existing GIS infrastructure, skills, and workflows. Identify gaps between current capabilities and project requirements. This assessment provides the foundation for targeted improvements.
2. Start with a Pilot Project 🚀
Rather than attempting organization-wide transformation immediately, select a single project for GIS integration. Choose a project with clear benefits, manageable complexity, and supportive stakeholders. Use this pilot to develop workflows, identify challenges, and demonstrate value before broader rollout.
3. Invest in Training and Skill Development 📚
Technology delivers value only when people can use it effectively. Prioritize training investments alongside software and hardware purchases. Develop internal expertise through formal courses, vendor training, and hands-on practice.
4. Establish Data Standards and Protocols 📋
Create organizational standards for coordinate systems, layer naming conventions, attribute schemas, and quality control procedures. Standardization ensures consistency across projects and enables knowledge transfer between team members.
5. Build Strategic Partnerships 🤝
Collaborate with GIS software vendors, data providers, and technology consultants who can provide expertise during implementation. Join professional organizations and user groups to learn from peers facing similar challenges.
6. Communicate Value to Clients 💬
Educate clients about GIS capabilities and how enhanced visualization and analysis benefit their projects. Incorporate GIS deliverables—interactive web maps, 3D models, spatial analyses—into proposals and presentations, differentiating your services from competitors still relying on traditional methods.
7. Plan for Continuous Improvement 📈
GIS technology evolves rapidly. Establish processes for evaluating new capabilities, updating workflows, and expanding applications. Regular technology reviews ensure your organization maintains competitive advantages as the industry advances.
The transformation of property surveying through GIS integration represents more than technological change—it fundamentally reimagines how spatial information drives decision-making in land development. Organizations that embrace this transformation position themselves as strategic advisors rather than mere data collectors, delivering insights that create measurable value for clients and stakeholders.
As we progress through 2026 and beyond, the gap between GIS-enabled and traditional surveying practices will continue widening. The question is no longer whether to integrate GIS into property surveying workflows, but how quickly and comprehensively to implement these capabilities to maintain relevance in an increasingly data-driven development landscape.
Whether you're conducting a comprehensive building survey, supporting development onboarding, or providing specialized measured building surveys, GIS integration enhances every aspect of professional practice. The tools, techniques, and workflows outlined in this guide provide a roadmap for that transformation—one that leads to better data, clearer communication, and smarter decisions throughout the land development process.
References
[1] New 2026 Minimum Standard Detail Requirements For Land Title Surveys – https://www.harrisbeachmurtha.com/insights/new-2026-minimum-standard-detail-requirements-for-land-title-surveys/
[2] Future Land Surveying 2026 – https://haller-blanchard.com/future-land-surveying-2026/
[3] Doubling Down On Digital – https://amerisurv.com/2026/02/01/doubling-down-on-digital/