Fewer than 30% of residential building defects in the UK are identified before they escalate into costly structural failures — yet the data needed to predict them often exists long before a surveyor sets foot on site. As Liverpool and the wider North of England experience a sustained surge in residential development in 2026, the integration of data analytics in building surveys is rapidly shifting from a niche innovation to a professional necessity. Data Analytics in Building Surveys: Predictive Tools for Defect Forecasting in Liverpool and Northern Projects sits at the heart of this transformation, offering surveyors, developers, and property owners a smarter, evidence-led approach to early issue detection.

Key Takeaways 📌
- Predictive analytics — including machine learning and time-series modelling — can flag building defects before they become visible or structurally dangerous.
- Liverpool and Northern England's high-demand residential market in 2026 makes early defect forecasting a critical cost-saving tool for developers and buyers.
- RICS-compliant integration of AI tools into building surveys is now actively supported by professional bodies and research institutions.
- University of Liverpool researchers are already applying AI-driven predictive platforms to infrastructure defect forecasting, signalling strong regional expertise [5].
- Data-driven surveys reduce remediation costs, improve safety outcomes, and strengthen negotiating positions for buyers and investors.
Why Predictive Defect Forecasting Is Changing the Survey Landscape
Traditional building surveys rely heavily on visual inspection — a skilled surveyor examines what can be seen, touched, and measured on the day. This approach has served the industry well for decades, but it has a fundamental limitation: it is reactive, not predictive. By the time damp penetration, subsidence, or roof degradation becomes visible, the defect has often been developing for months or years.
Predictive defect forecasting changes this dynamic entirely. By combining historical building data, environmental records, material performance benchmarks, and real-time sensor inputs, analytical models can estimate where and when defects are likely to emerge — before they manifest physically.
💬 "The shift from inspection to prediction is not just a technological upgrade — it is a fundamental reimagining of what a building survey can achieve."
This matters enormously in Liverpool and the North of England, where a significant proportion of housing stock dates from the Victorian and Edwardian eras. Older brick construction, shallow foundations, and legacy drainage systems create a predictable — and therefore modelable — pattern of failure modes. When these properties are bought, sold, or renovated at scale, as is happening across Merseyside and Greater Manchester in 2026, the ability to forecast defects across entire portfolios becomes a powerful commercial advantage.
For buyers wanting to understand what a thorough inspection actually involves, reviewing what questions you should be asking during a building survey provides a strong foundation before commissioning any survey work.
The Core Technologies Behind Data Analytics in Building Surveys: Predictive Tools for Defect Forecasting in Liverpool and Northern Projects
Understanding the technology stack behind predictive surveying helps both professionals and property owners appreciate what modern analytics can — and cannot — deliver.
Machine Learning and Gradient Boosting
Gradient boosting algorithms are among the most widely applied machine learning techniques in predictive analytics. They work by building a sequence of decision trees, each correcting the errors of the last, to produce highly accurate predictions from complex datasets [2]. In a building survey context, these models can be trained on thousands of previous survey reports, correlating factors such as:
- Property age and construction type
- Local climate and rainfall data
- Previous maintenance records
- Material degradation benchmarks
The result is a defect probability score for each element of a building — roof, walls, foundations, drainage — that surveyors can use to prioritise inspection focus.
LSTM Networks and Time-Series Analysis
Long Short-Term Memory (LSTM) networks are a type of recurrent neural network particularly suited to time-series data [2]. For building defect forecasting, this means modelling how a defect evolves over time — for example, tracking how a minor crack in brickwork might progress to structural movement over a 5-year period given specific loading and moisture conditions.
This temporal dimension is especially valuable for planned maintenance programmes on large residential blocks and commercial properties across Northern England, where lifecycle cost modelling drives major investment decisions.
Ensemble Methods and Continuous Retraining
No single model is perfect. Ensemble methods combine multiple predictive models to reduce error and improve robustness [2]. Crucially, best-practice analytics platforms incorporate continuous model retraining — feeding new inspection data back into the model so predictions improve over time. This creates a virtuous cycle: the more surveys are completed and logged, the more accurate future forecasts become.
| Technique | Best Use Case | Key Benefit |
|---|---|---|
| Gradient Boosting | Portfolio-level defect scoring | High accuracy with structured data |
| LSTM Networks | Time-series defect evolution | Temporal prediction capability |
| Ensemble Methods | Multi-factor risk assessment | Reduced prediction error |
| Sensor Integration | Real-time structural monitoring | Continuous early warning |
Liverpool and the North: A Regional Case for Predictive Survey Analytics

Liverpool's property market in 2026 is characterised by strong demand, significant regeneration investment, and a large volume of older housing stock requiring careful due diligence. The city's distinctive built environment — from Georgian terraces in Toxteth to post-war social housing in Speke — presents a rich and varied dataset for predictive modelling.
Research at the University of Liverpool is already demonstrating the region's capacity for AI-driven predictive infrastructure tools. Professor Xiaowei Huang's ARRES FORECAST project, funded by Innovate UK, applies AI to predict defect evolution in road infrastructure — a methodology with clear transferable principles for building defect forecasting [5]. The existence of this research capability in Liverpool signals a strong regional ecosystem for applied predictive analytics in the built environment.
Key Defect Patterns in Northern Residential Stock
Northern England's climate — higher rainfall, lower winter temperatures, and greater freeze-thaw cycling than the South — accelerates specific defect pathways:
- 🧱 Spalling brickwork from moisture ingress and freeze-thaw action
- 💧 Roof tile displacement and lead flashing failure
- 🏚️ Subfloor timber decay in Victorian terrace properties
- 🌊 Drainage failure linked to clay soil movement
- 🔩 Lintel corrosion in 1960s–1980s construction
Predictive models trained on Northern England data can weight these failure modes appropriately, producing more locally relevant risk assessments than generic national benchmarks.
For properties with complex material compositions, a building materials assessment provides the detailed baseline data that feeds effectively into predictive analytics platforms.
RICS Compliance and Professional Integration
A critical question for any surveyor considering predictive tools is whether their use aligns with RICS professional standards. The answer, increasingly, is yes — with important caveats.
The RIBA AI in Architecture and Construction Report highlights growing institutional support for AI-assisted professional workflows, provided that human professional judgement remains central to any output [3]. RICS guidance similarly emphasises that AI tools should augment, not replace, qualified surveyor assessment. This means predictive analytics outputs must be interpreted within the context of a full Level 3 building survey and documented transparently in the final report.
The AI4QS Report (AI for Quantity Surveyors) published in 2025 further confirms that AI adoption across built environment professions is accelerating, with data-driven risk assessment becoming an expected competency for senior practitioners [4].
Practical Application: How Data Analytics in Building Surveys Works in Northern Projects
Implementing Data Analytics in Building Surveys: Predictive Tools for Defect Forecasting in Liverpool and Northern Projects in practice involves several interconnected steps.
Step 1: Data Collection and Baseline Establishment
Effective prediction requires quality data. For a Liverpool residential development or portfolio, this means gathering:
- Historical survey reports for comparable properties in the area
- Environmental datasets (rainfall, temperature, soil type)
- Building age and construction records from local authority archives
- Previous maintenance logs where available
- IoT sensor data from smart monitoring systems installed in newer builds
Step 2: Model Selection and Calibration
Not every project warrants the same analytical approach. A single Victorian terrace purchase may benefit from a gradient boosting risk score applied to comparable properties, while a large residential development in Salford or Liverpool city centre might justify a full LSTM time-series model tracking defect evolution across the build lifecycle.
Surveyors working with data science partners must calibrate models to local conditions — Northern England datasets should not simply borrow from Southern or national benchmarks without adjustment.
Step 3: Integration with the Physical Survey
Predictive outputs should inform, not replace, the physical inspection. A high-risk score for roof degradation, for example, directs the surveyor to spend more time on that element, use thermal imaging, or recommend specialist investigation. This is precisely the kind of targeted approach that a full building survey is designed to accommodate.
Understanding how long a building survey takes helps clients plan appropriately when data-enhanced inspections require additional specialist input.
Step 4: Reporting and Client Communication
Predictive analytics outputs must be communicated clearly to non-technical clients. Best practice involves:
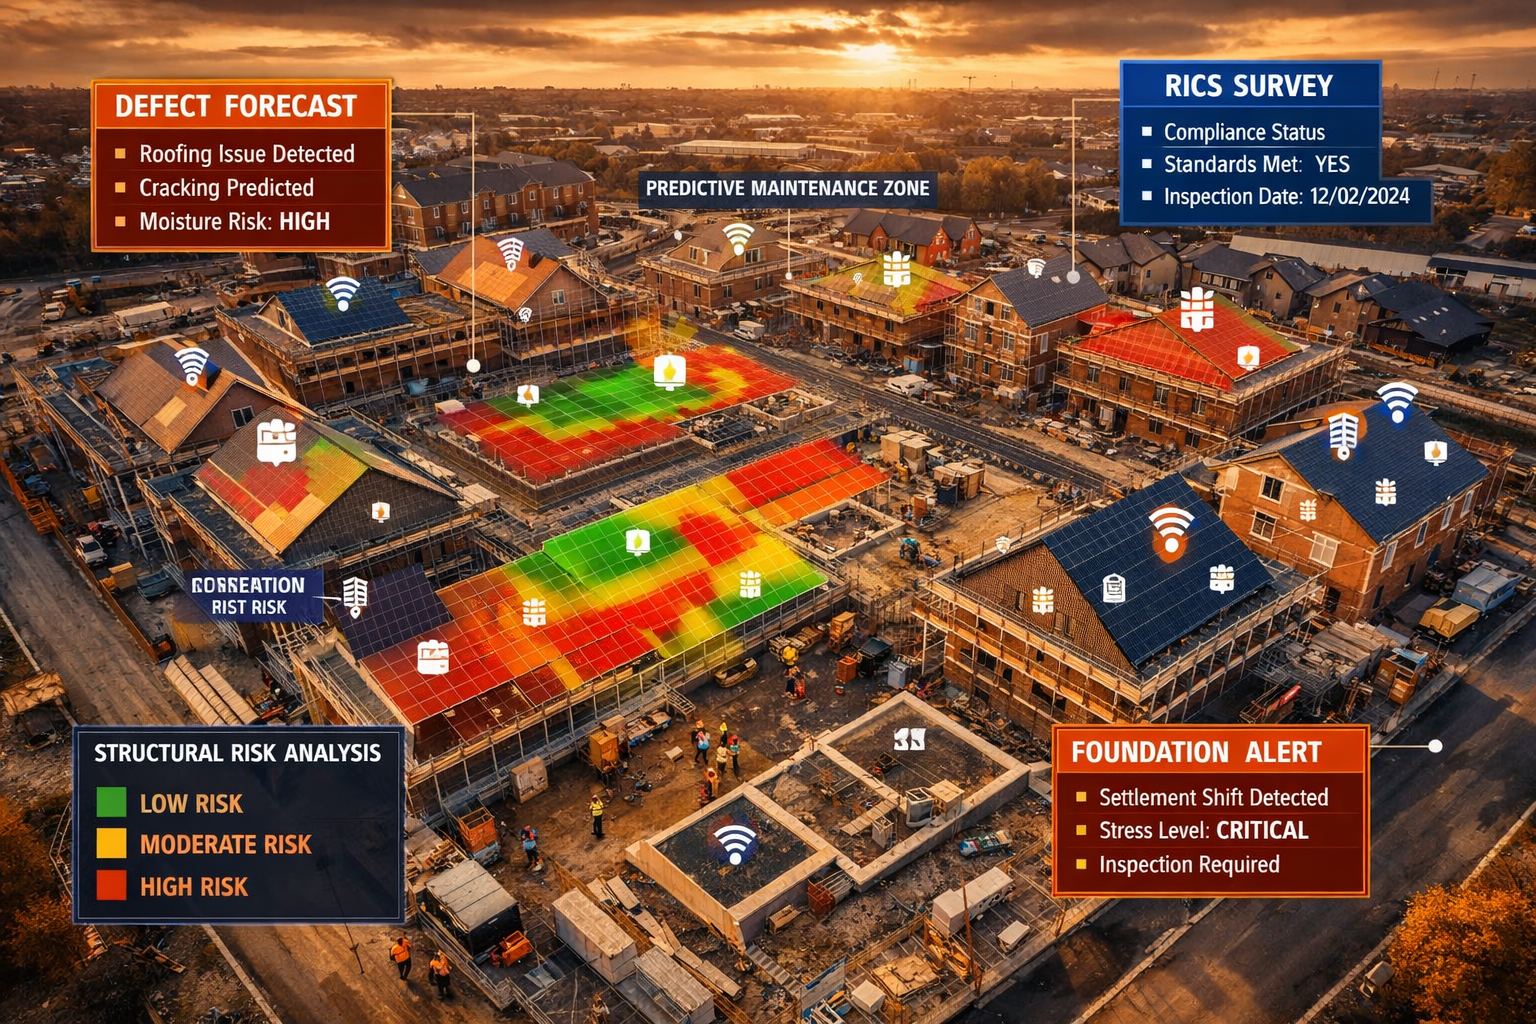
- Traffic-light risk ratings for each building element
- Probability ranges rather than false certainty (e.g., "70–85% likelihood of roof tile failure within 5 years")
- Cost estimate ranges for predicted remediation
- Recommended review timelines for borderline-risk elements
This structured approach aligns with the kind of transparent, client-focused reporting that underpins professional surveying standards.
Big Data Applications for Early Issue Detection in High-Demand Residential Builds
The 2026 Northern property market is not just about resale stock. Significant new residential development is underway across Liverpool, Manchester, Leeds, and Sheffield — and new builds carry their own defect risk profile that predictive analytics is well-placed to address.
Snagging at Scale
Large residential developments involving hundreds of units face a snagging challenge that manual inspection alone cannot efficiently solve. Data analytics tools can:
- Cluster common defect types by contractor, subcontractor, or build phase
- Identify systemic issues (e.g., a specific roofing contractor consistently producing poor flashings) before they affect the entire development
- Prioritise snagging inspection on highest-risk units based on build sequence and weather exposure during construction
For buyers of new builds, understanding what house snagging involves and when a snagging survey is necessary is an essential first step before accepting a new property.
Environmental Risk Layering
Northern England's environmental context adds complexity that predictive models must address. Flooding risk, ground contamination from industrial heritage, and radon exposure in certain geological zones all interact with building defect trajectories. Integrating environmental risk data into defect forecasting models produces more comprehensive risk profiles — a capability that connects directly to environmental issues assessments within the full building survey process.
Portfolio-Level Decision Making
For institutional investors, housing associations, and large landlords operating across Liverpool and the North, portfolio-level defect forecasting transforms asset management. Rather than reactive maintenance triggered by tenant complaints or visible failure, data-driven planned maintenance programmes can:
- Reduce emergency repair costs by up to 25–40%
- Extend asset lifecycle through timely intervention
- Improve compliance with housing standards legislation
- Strengthen insurance and valuation positions
Challenges and Limitations to Consider
Honest engagement with predictive analytics requires acknowledging its limitations:
- Data quality dependency: Models are only as good as the data fed into them. Incomplete or inaccurate historical records produce unreliable predictions.
- Local calibration requirements: National or international models must be adapted to Northern England's specific building stock and climate.
- Professional liability: Surveyors remain professionally responsible for their reports. Predictive tool outputs do not transfer liability to the technology provider.
- Client understanding: Communicating probabilistic outputs to clients unfamiliar with statistical reasoning requires clear, jargon-free explanation.
- Cost of implementation: Smaller surveying practices may face barriers to adopting sophisticated analytics platforms without industry-level support or shared data infrastructure.
The AI4QS Report notes that while AI adoption in the built environment professions is growing rapidly, skills gaps and data governance challenges remain significant barriers to full implementation [4].
Conclusion: Actionable Next Steps for Surveyors, Developers, and Property Owners
Data Analytics in Building Surveys: Predictive Tools for Defect Forecasting in Liverpool and Northern Projects represents one of the most significant advances in property risk assessment of the past decade. As the Northern England market continues its strong growth trajectory through 2026, those who integrate predictive analytics into their survey and development workflows will hold a measurable competitive advantage.
Actionable Next Steps ✅
- Commission a Level 3 Building Survey for any older Northern England property purchase — this provides the comprehensive baseline data that feeds predictive models effectively.
- Ask surveyors about data-enhanced inspection methods — including thermal imaging, moisture mapping, and any analytics tools used to supplement visual inspection.
- Request structured risk ratings in survey reports, not just narrative descriptions, to enable clear prioritisation of remediation.
- For developers and investors: explore partnerships with data science providers to build portfolio-level defect forecasting capability.
- Stay engaged with RICS guidance on AI tool integration to ensure compliance as standards evolve.
- For new build buyers: commission a professional snagging survey and request data on common defect patterns from the development's build phase.
The convergence of regional expertise, institutional research capability at Liverpool's universities, and growing professional acceptance of AI-assisted surveying creates a genuinely exciting opportunity for the North's property sector. The question is no longer whether data analytics belongs in building surveys — it is how quickly the profession can scale its adoption responsibly.
References
[1] Tgbt Jcis Jl%20revised – https://livrepository.liverpool.ac.uk/3172249/1/TGBT_JCIS_JL%20revised.docx
[2] Predictive Analytics In Demand Forecasting Reducing Waste And Delays – https://www.maclogistics.co.uk/predictive-analytics-in-demand-forecasting-reducing-waste-and-delays/
[3] Riba Ai Report 2025 Final – https://www.riba.org/media/uqmlay5m/riba-ai-report-2025-final.pdf
[4] Ai4qs Report 2025 1 – https://www.open-access.bcu.ac.uk/16837/1/AI4QS-Report-2025-1.pdf
[5] xiaowei – https://cgi.csc.liv.ac.uk/xiaowei/