{"cover":"Professional landscape format (1536×1024) hero image with bold text overlay: 'RICS February 2026: Navigating the -26% Buyer Enquiry Slump' in extra large 72pt white bold sans-serif font with dark semi-transparent overlay box, centered upper third. Background shows a wide-angle aerial view of a traditional British residential street with terraced houses, subtle downward red arrow graphic overlaid on the street, muted navy blue and charcoal color palette with white and amber accents. Editorial magazine cover quality, high contrast, professional property market aesthetic.","content":["Detailed landscape format (1536×1024) infographic-style image showing a declining bar chart with RICS net balance figures: January -26%, February -29%, March -39% for new buyer enquiries, rendered in dark navy and red color scheme on a clean white background. Small inset map of UK with regional heat zones. A chartered surveyor in professional attire reviews printed survey data at a desk with a laptop showing property graphs. Text label: 'RICS Residential Survey Data 2026'. Editorial financial data visualization aesthetic, sharp and professional.","Landscape format (1536×1024) split-scene image: left half shows a London skyline with cooling property market overlay — translucent downward price arrow graphic in red over city rooftops at dusk. Right half shows a rural/suburban English village street with green upward arrow suggesting regional divergence. Center dividing line with text label 'Regional Price Divergence 2026'. Color palette: deep teal, warm amber, white. Clean editorial composition with a chartered surveyor silhouette examining a valuation report in the foreground, wide-angle perspective.","Landscape format (1536×1024) close-up editorial scene of a professional chartered surveyor seated across a desk from a mortgage lender representative, both reviewing a detailed property valuation report with highlighted comparable sales data and risk assessment sections. On the desk: a laptop showing RICS survey charts, printed floor plans, and a pen marking key figures. Warm office lighting, professional attire, bookshelves with surveying reference books in background. Color palette: warm cream, navy, gold accents. High-resolution, editorial boardroom quality."}

A net balance of -26% for new buyer enquiries in February 2026 was not a blip — it was the opening chapter of a deepening market correction that has since accelerated sharply. The Chartered Surveyor Insights from RICS February 2026 Residential Survey: Navigating -26% Buyer Enquiry Slump in Valuations reveal a UK housing market under real pressure, squeezed by rising borrowing costs, geopolitical instability, and a buyer population that has shifted from "want to move" to strictly "have to move." For property professionals, lenders, and homeowners alike, understanding what these numbers mean — and how to respond — is now essential. [2]
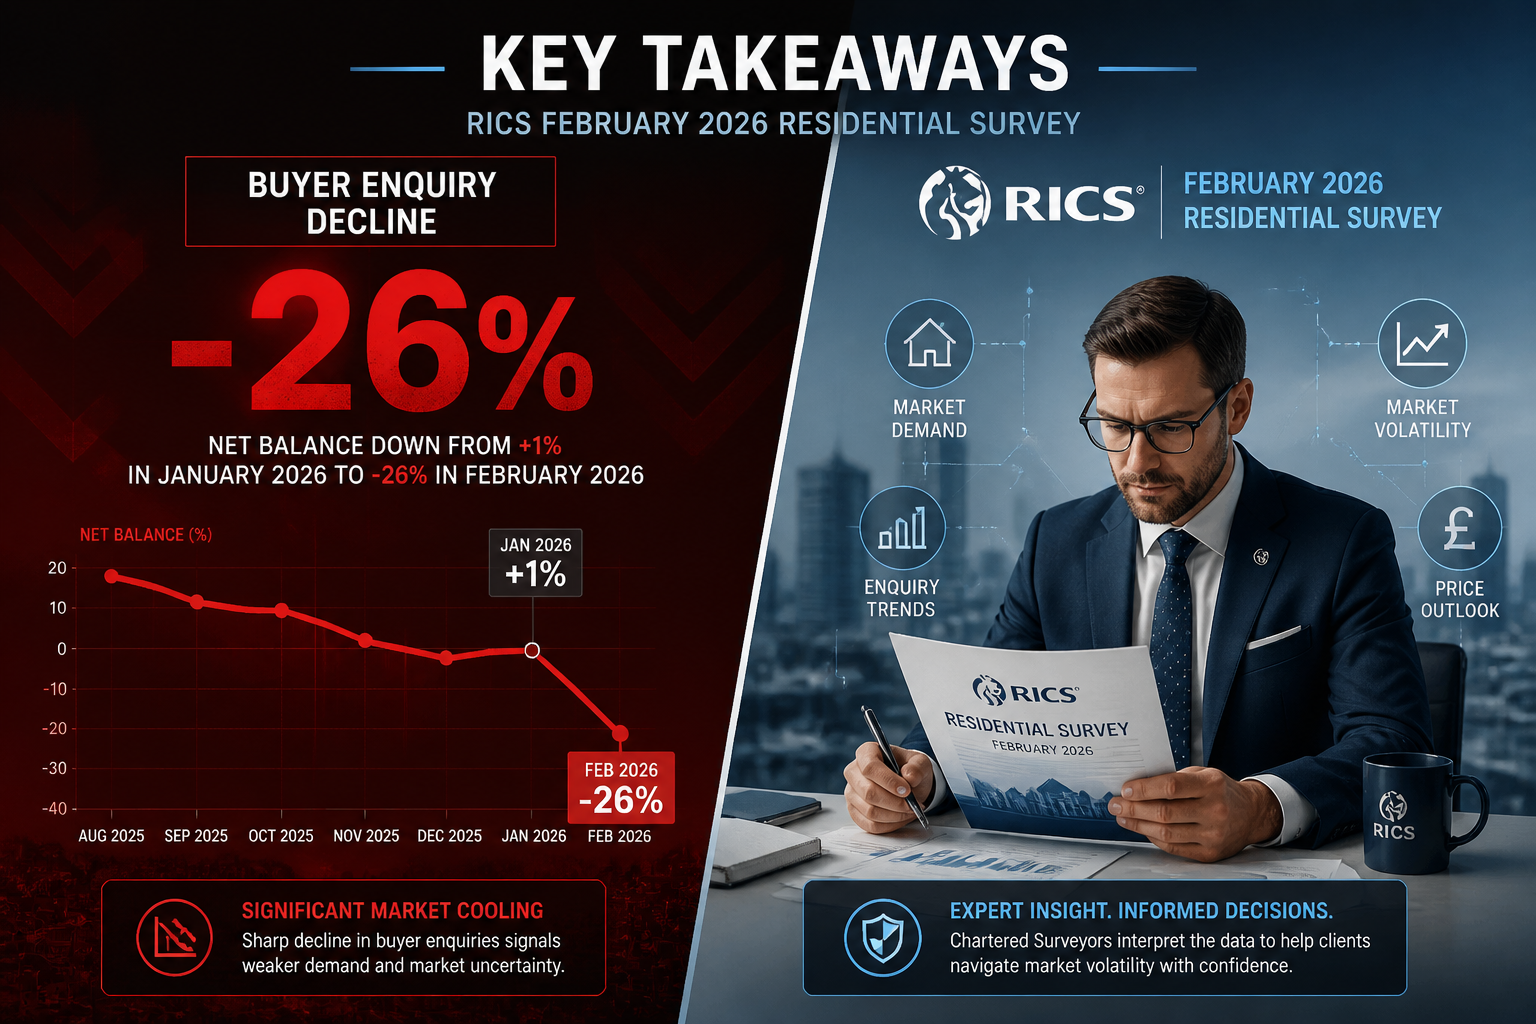
Key Takeaways 📌
- New buyer enquiries fell to -26% in February 2026, worsening to -39% by March — the weakest reading since August 2023. [1][2]
- House price balances are declining, with the headline figure dropping to -23% in March, signalling broad downward pressure on values. [1]
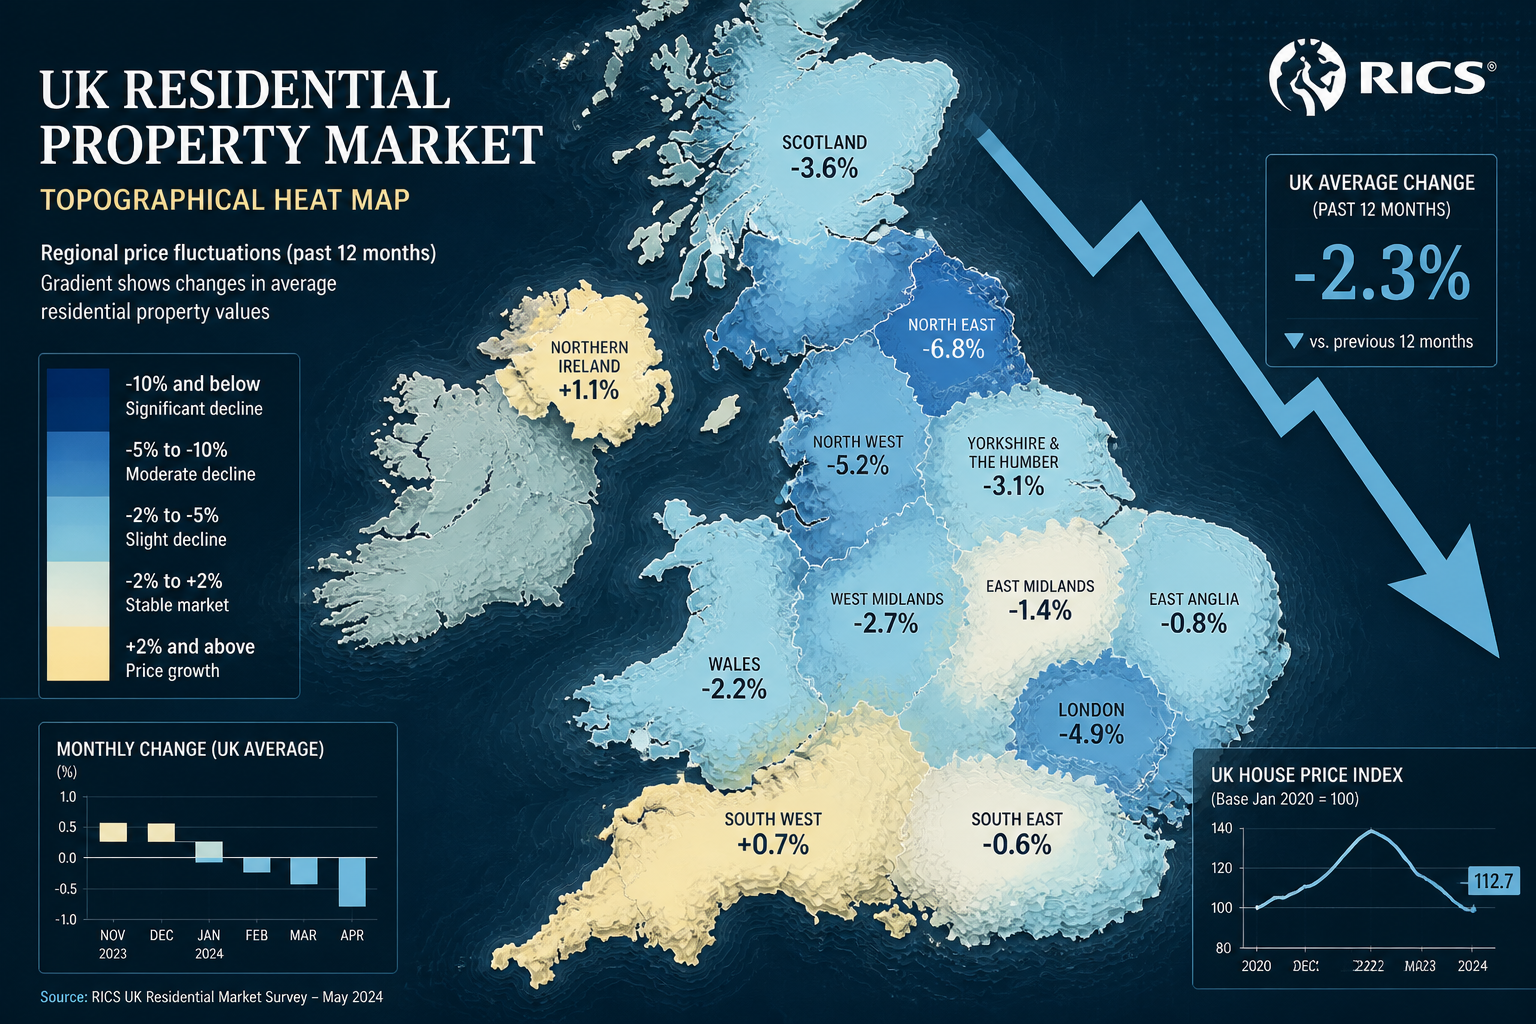
- Regional divergence is widening: London and the South East are cooling fastest, while some regional markets show relative resilience.
- Lender confidence strategies — including robust comparable evidence and transparent risk disclosure — are now critical tools for chartered surveyors.
- Necessity-driven buyers dominate the current market, fundamentally changing how valuations must be framed and justified. [1]
Understanding the RICS Data: A Market in Retreat
What the February 2026 Numbers Actually Mean
The RICS UK Residential Market Survey for February 2026 recorded a new buyer enquiries net balance of -26%, down from -15% in January. [2] To understand the significance, a net balance measures the difference between the percentage of surveyors reporting an increase versus those reporting a decrease. A reading of -26% means substantially more professionals are seeing enquiry volumes fall than rise.
This was not an isolated reading. By March 2026, that figure had deteriorated further to -39% — a level of weakness not recorded since August 2023. [1] Agreed sales followed the same trajectory, collapsing from -13% in February to -34% in March, indicating that the pipeline of transactions is draining rapidly.
The Drivers Behind the Decline
Three forces are converging to suppress buyer activity:
- 🏦 Rising borrowing costs — Mortgage rates remain elevated, eroding purchasing power and pushing monthly repayments beyond the comfort zone for many households.
- 🌍 Geopolitical uncertainty — The ongoing Middle East conflict has introduced macro-level anxiety into financial markets, feeding through to consumer confidence and lender risk appetite. [1]
- 💷 Affordability ceilings — Even where buyers are motivated, stretched income multiples and deposit requirements are blocking transactions.
As RICS survey respondent Trevor Brown FRICS observed, the market entering what should be a traditionally strong spring period "remains sluggish," with most clients being "have to move" rather than "want to move" buyers. [1] This is a profound shift. Discretionary movers — those upgrading, downsizing by choice, or relocating for lifestyle reasons — have largely stepped back.
💬 "Most of our clients are 'have to move' not 'want to move' — the discretionary buyer has effectively left the building." — Trevor Brown FRICS [1]
Chartered Surveyor Insights from RICS February 2026 Residential Survey: Regional Price Divergence and Valuation Challenges
House Price Pressures Are Not Uniform
The headline house price balance fell to -23% in March 2026, down from -14% in February and -10% in January. [1] Three-month price expectations have weakened sharply to -43%, while 12-month price expectations sit at a modest +2% — suggesting surveyors see near-term pain before any stabilisation. [1]
However, these national averages mask significant regional divergence. London and the commuter belt — particularly prime and near-prime zones — are experiencing the sharpest cooling. Areas with high concentrations of discretionary buyers, second-home purchasers, and international demand are most exposed.
Regional Snapshot: Where Valuations Face Greatest Pressure
| Region | Market Pressure | Key Valuation Challenge |
|---|---|---|
| Central London | High | Thin comparable sales; price discovery gaps |
| South East (Surrey, Berkshire) | Moderate-High | Mortgage affordability constraints |
| South West | Moderate | Seasonal demand masking structural weakness |
| Midlands & North | Lower | Relative affordability providing support |
| Scotland & Wales | Variable | Local economic factors dominating |
For chartered surveyors in Surrey and across the Berkshire region, where property values are closely tied to London employment markets and mortgage-dependent buyers, the February data represents a genuine valuation stress test.
The Comparable Evidence Problem
When transaction volumes fall sharply, the pool of recent comparable sales — the bedrock of any robust valuation — shrinks. Surveyors face a difficult choice: use older comparables that may not reflect current market sentiment, or apply manual adjustments that can be challenged by lenders and clients alike.
Best practice in this environment includes:
- Widening the geographic search radius for comparables while applying appropriate adjustments for location differentials
- Documenting market conditions explicitly within valuation reports, referencing RICS survey data as supporting evidence
- Applying conservative adjustments where the direction of travel is clearly downward, supported by the -43% three-month price expectation balance [1]
- Flagging material uncertainty where the evidence base is thin — a professional obligation that protects both the surveyor and the lender
For those considering property development valuations, the challenge is compounded: residual valuations are highly sensitive to end-value assumptions, and a -23% price balance environment demands particularly rigorous stress-testing of those assumptions.
Chartered Surveyor Insights from RICS February 2026 Residential Survey: Strategies for Enhancing Lender Confidence

Why Lender Confidence Is the Central Issue Right Now
Short-term sales expectations fell to -33% in March 2026, compared with -4% in February. [1] This near-vertical drop in sentiment means lenders are recalibrating their risk models in real time. Mortgage underwriters are scrutinising valuations more carefully, and the margin for ambiguity in a surveyor's report has narrowed considerably.
The professional imperative is clear: chartered surveyors must produce valuations that are not only accurate but demonstrably defensible.
Practical Strategies for Surveyors in a Cautious Market
1. Strengthen the Comparable Evidence Section
In a thin market, the quality of comparable evidence matters more than ever. Each comparable should be accompanied by a clear explanation of its relevance, the adjustments applied, and the rationale for weighting. Lenders reviewing files in a declining market will look for this transparency.
2. Use RICS Data as Contextual Evidence
The February 2026 RICS survey data provides authoritative market context. Referencing the -26% buyer enquiry balance, the deteriorating agreed sales figures, and the -43% three-month price expectation within a valuation report demonstrates that the surveyor is working within a well-documented market framework. [2]
3. Apply Explicit Market Condition Adjustments
Where the market is clearly moving in one direction, valuations should reflect that trajectory. A property valued in March 2026 against comparables from Q4 2025 requires a documented downward adjustment — not as pessimism, but as professional accuracy.
4. Flag Risks Clearly and Early
Lenders appreciate surveyors who identify and articulate risk rather than bury it. Properties with features that amplify market risk — unusual construction, limited comparable pool, high-value outliers in their locality — should carry explicit risk commentary. For complex cases involving urgent or dangerous building issues, this is even more critical.
5. Consider the "Necessity Buyer" Profile
Trevor Brown FRICS's observation about necessity-driven buyers is directly relevant to valuation methodology. [1] A market dominated by forced sellers and necessity buyers tends to produce lower transaction prices than one driven by aspirational movers. This dynamic should inform how surveyors interpret and weight their comparable evidence.
The Role of Specialist Valuations
In a market where standard residential valuations are under pressure, specialist valuation services take on added importance. Right to buy valuations, for instance, operate under statutory frameworks that provide a degree of insulation from open-market volatility — but they still require surveyors to accurately reflect current market conditions.
For a broader overview of professional valuation services in the current environment, the Prince Chartered Surveyors valuations page provides a comprehensive reference point for both clients and professionals.
What Buyers, Sellers, and Investors Should Do Now
For Buyers 🏠
The data is not entirely discouraging for buyers. A -23% house price balance and -43% three-month price expectation [1] suggest that negotiating power has shifted meaningfully toward purchasers. Buyers who can demonstrate mortgage readiness and move quickly are in a stronger position than at any point in the last two years.
Key actions:
- Commission a full building survey before committing — defects discovered post-exchange in a declining market are harder to recover through negotiation
- Use current market data to support price negotiations
- Focus on properties with strong fundamentals: good transport links, schools, and energy efficiency ratings
For Sellers 🏡
Discretionary sellers face the hardest environment. With 12-month sales expectations at just -1% [1], the market is not expected to recover meaningfully in the near term.
Practical steps:
- Price realistically from the outset — overpriced properties in a -26% enquiry environment will simply not generate viewings
- Invest in presentation: professional photography and accurate floor plans remain cost-effective tools
- Be prepared for longer marketing periods and consider whether the timing is genuinely right
For Property Investors 📊
The +2% 12-month price expectation [1] suggests minimal capital growth in the near term. Investors should focus on:
- Yield-driven acquisitions rather than capital growth plays
- Locations with structural demand drivers (universities, major employers, transport hubs)
- Properties requiring improvement, where value can be added independently of market conditions — understanding what factors drive property valuations is essential here
The Outlook: Navigating the Road Ahead
The trajectory from Chartered Surveyor Insights from RICS February 2026 Residential Survey: Navigating -26% Buyer Enquiry Slump in Valuations through to March's -39% reading [1] tells a consistent story: this is not a temporary wobble. The combination of elevated borrowing costs, geopolitical uncertainty, and stretched affordability has created a structurally weaker market that will require time — and likely a meaningful shift in interest rate expectations — to recover.
Capital Economics' analysis of the February 2026 RICS data noted that geopolitical events had already tempered what had been early-year strengthening, with heightened macro uncertainty affecting near-term expectations across the board. [3]
For chartered surveyors, the professional response is straightforward even if the market is not: rigorous methodology, transparent reporting, and proactive communication with clients and lenders. The surveyors who navigate this period successfully will be those who treat market weakness not as a problem to work around, but as context to work with.
For buyers and sellers in specific locations — whether Weybridge, Kingston, or West London — local market knowledge combined with national RICS data provides the most reliable compass for decision-making in 2026.
Conclusion: Actionable Next Steps
The RICS February 2026 residential survey data — and its subsequent deterioration in March — demands a clear-eyed response from everyone involved in the property market.
For chartered surveyors:
✅ Strengthen comparable evidence documentation and apply explicit market condition adjustments
✅ Reference RICS survey data within valuation reports to contextualise findings for lenders
✅ Flag material uncertainty proactively, particularly in thin-transaction markets
✅ Engage in continuing professional development around valuation methodology in declining markets
For buyers:
✅ Use the shift in negotiating power — commission a thorough survey and negotiate on findings
✅ Act decisively if mortgage-ready; necessity sellers are motivated
For sellers:
✅ Price to the current market, not the market of 12 months ago
✅ Seek an independent valuation from a qualified chartered surveyor before listing
For investors:
✅ Prioritise yield over capital growth in the near term
✅ Focus on locations with structural demand drivers
The -26% buyer enquiry reading of February 2026 was a warning signal. The subsequent data confirms the trend. The professionals and property owners who act on these insights now will be far better positioned when market conditions eventually stabilise.
References
[1] UK Housing Market Slows As Ongoing Middle East Conflict Raises Borrowing Costs – https://www.rics.org/news-insights/uk-housing-market-slows-as-ongoing-middle-east-conflict-raises-borrowing-costs
[2] UK Residential Market Survey February 2026 – https://www.rics.org/content/dam/ricsglobal/documents/market-surveys/uk-residential-market-survey/UK-Residential-Market-Survey_February-2026.pdf
[3] UK RICS Residential Market Survey Feb 2026 – https://www.capitaleconomics.com/publications/uk-housing-market-update/uk-rics-residential-market-survey-feb-2026
[4] Valuation Challenges In Weak Buyer Demand RICS February 2026 Survey Analysis And Surveyor Strategies – https://nottinghillsurveyors.com/blog/valuation-challenges-in-weak-buyer-demand-rics-february-2026-survey-analysis-and-surveyor-strategies