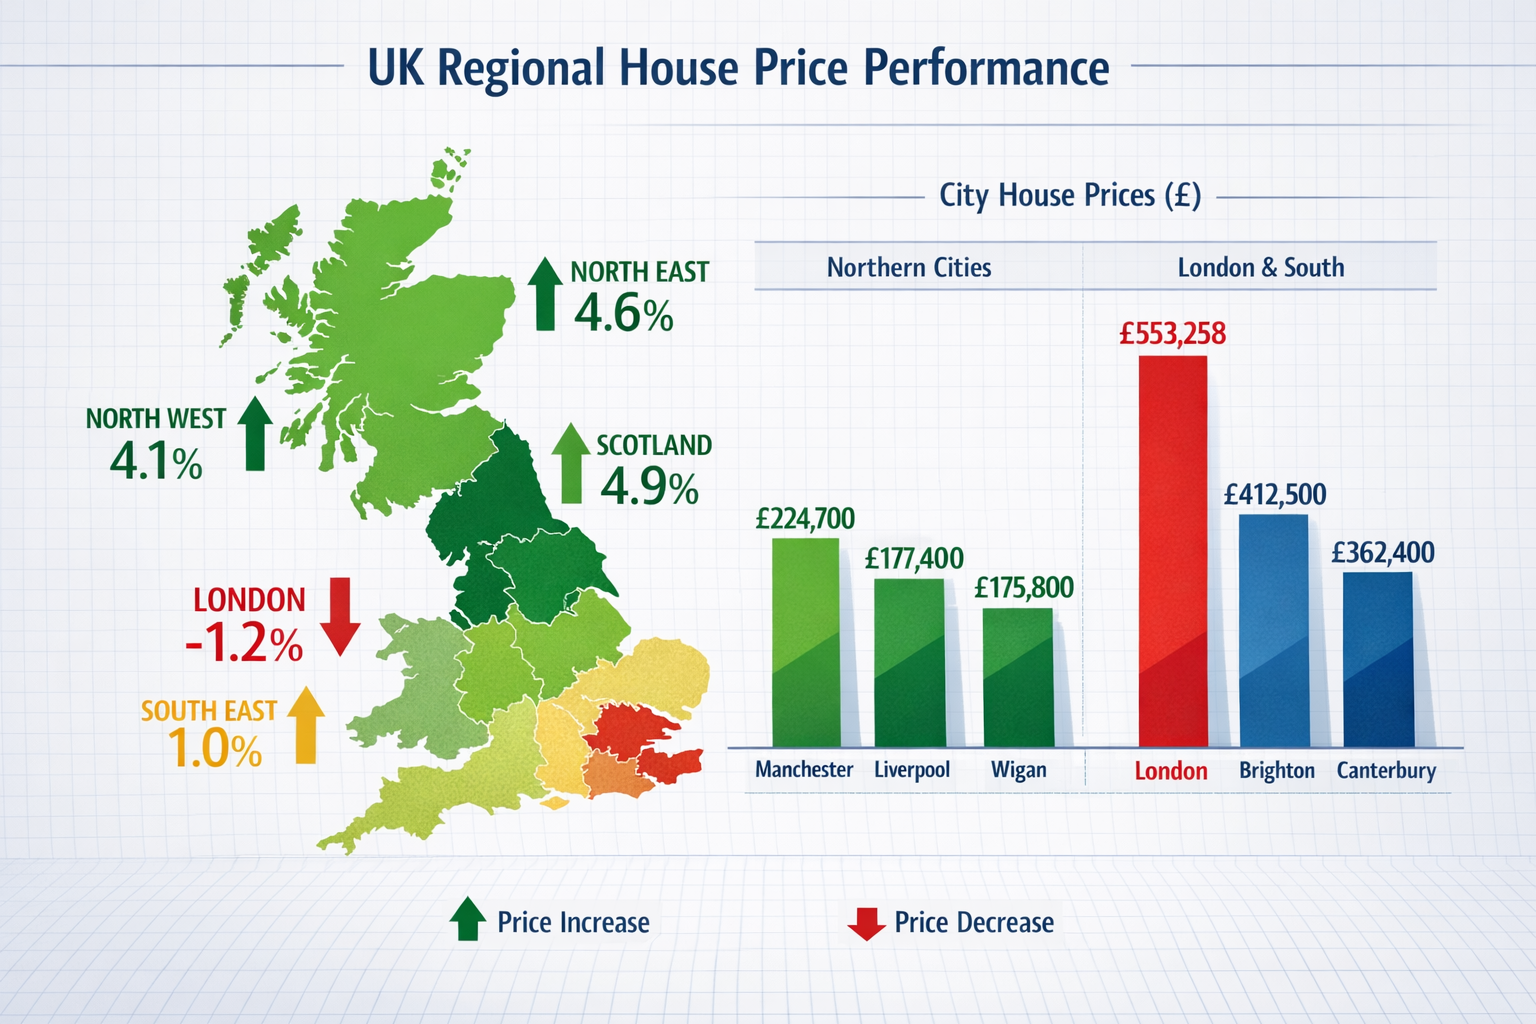
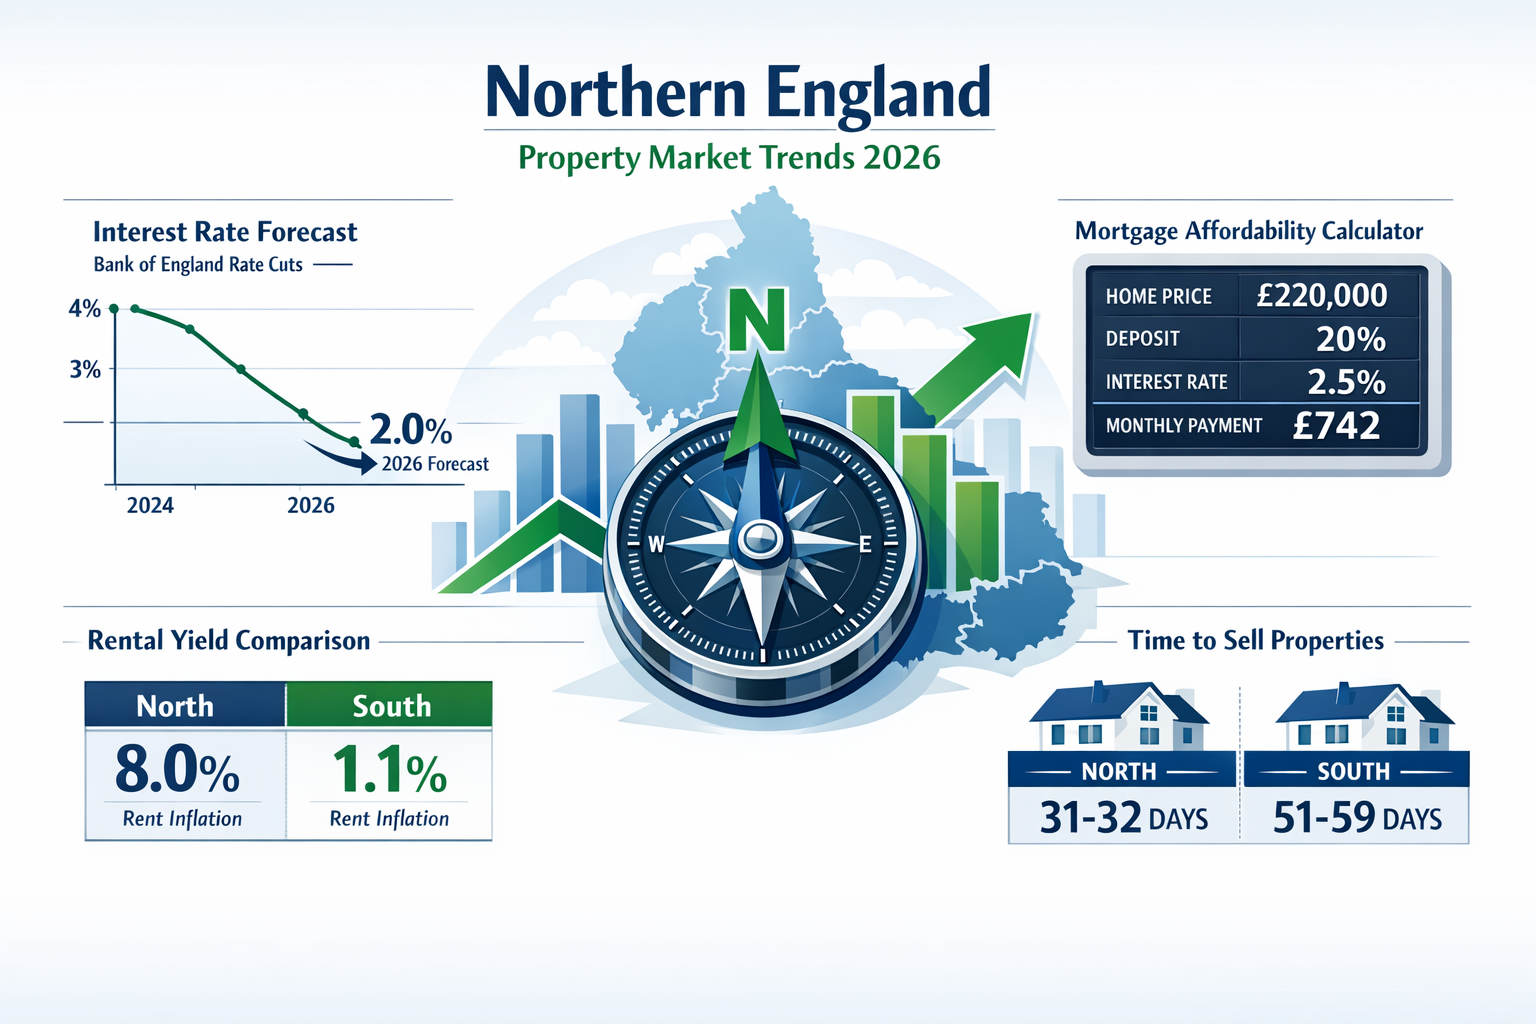
{"cover":"Professional landscape format (1536x1024) editorial hero image featuring bold text overlay 'Valuing Northern England Properties in 2026: Chartered Surveyor Strategies Amid Price Surges and Southern Stagnation' in extra large 72pt white sans-serif font with dark shadow effect, positioned in upper third with perfect alignment. Background shows split-screen composition: left side displays vibrant Northern England terraced houses and modern apartments with upward trending price graph overlay in green, right side shows London and Southern properties with flat or declining red trend lines. Include subtle RICS logo watermark, professional surveyor with tablet examining property in foreground, color scheme of deep navy blue, white, green growth indicators and red decline markers. High contrast, magazine cover quality, financial editorial style with clean modern aesthetic.","content":["Detailed landscape format (1536x1024) infographic showing UK regional house price performance map with color-coded regions: North East in dark green showing 4.6% growth, North West in medium green at 4.1%, Scotland in light green at 4.9%, contrasted with London in red showing -1.2% decline, South East in pale yellow at 1.0% growth. Include data visualization elements: bar charts comparing Manchester (£224,700), Liverpool (£177,400), Wigan (£175,800) versus London (£553,258), Brighton, Canterbury. Professional financial aesthetic with percentage annotations, upward and downward arrows, clean typography, modern color palette of greens, reds, blues, white background with subtle grid pattern.","Detailed landscape format (1536x1024) professional illustration showing chartered surveyor conducting property valuation in Northern England Victorian terraced house. Surveyor in business attire holding RICS-approved tablet and laser measuring device, examining structural elements. Visual overlays showing comparable sales data points, valuation methodology flowchart, RICS Red Book guidelines checklist. Include split-screen elements: one side showing traditional comparable sales method with property photos and prices, other side displaying modern digital valuation tools, heat maps, market analytics. Color scheme: professional navy blue, white, gold RICS accents, clean architectural photography style with technical annotations.","Detailed landscape format (1536x1024) strategic planning visualization showing future property market trends for 2026. Central focus on Northern England property investment opportunities with visual elements: interest rate forecast chart showing Bank of England rate cuts, mortgage affordability calculator display, rental yield comparison table between North (8.0% rent inflation) and South (1.1%). Include visual metaphors: compass pointing north indicating growth direction, time-to-sell comparison showing Northern properties at 31-32 days versus Southern at 51-59 days. Professional financial planning aesthetic with charts, graphs, percentage indicators, modern color palette of deep blue, green growth indicators, white background, clean infographic style with data-driven visual hierarchy."]}

The UK property market has undergone a dramatic transformation, creating a stark geographical divide that challenges traditional valuation approaches. Valuing Northern England Properties in 2026: Chartered Surveyor Strategies Amid Price Surges and Southern Stagnation requires chartered surveyors to adapt their methodologies to account for unprecedented regional divergence. While Northern regions experience robust price appreciation—with the North East leading at 4.6% annual growth and the North West close behind at 4.1%[2]—Southern markets face stagnation or decline, with London experiencing a -1.2% contraction[1][3]. This geographical split demands sophisticated valuation strategies that recognize distinct market dynamics, comparable sales challenges, and evolving RICS guidance.
Key Takeaways
- 📈 Northern England leads UK growth with the North East achieving 4.6% annual house price increases and the North West at 4.1%, while London contracts at -1.2%[2][3]
- 🏘️ Regional comparable sales require careful selection as Northern markets demonstrate faster transaction times (31-32 days) versus Southern markets (51-59 days)[1]
- 📊 RICS Red Book compliance demands regional context with chartered surveyors adjusting valuation methodologies to reflect divergent market conditions
- 💷 Price reduction patterns differ dramatically with Southern properties showing 29-39% requiring cuts over 5%, compared to just 9-19% in Northern England[1]
- 🔮 2026 forecasts predict continued divergence with overall UK growth at 2.5% driven predominantly by Midlands and Northern regions[3]
Understanding the 2026 Regional Property Market Divide
The Northern Surge: Data-Driven Analysis
The performance of Northern England property markets in 2026 represents a fundamental shift in UK real estate dynamics. The North East's 4.6% annual growth[2] positions it as England's strongest performer, though this represents a moderation from the 7.5% recorded in November 2025. This deceleration reflects market normalization rather than weakness, as the region maintains substantial momentum.
The North West demonstrates equally impressive resilience with 4.1% annual growth[2]. Manchester, the region's economic powerhouse, shows 1.9% appreciation with average prices reaching £224,700 as of January 2026[1]. However, the broader North West story extends beyond Manchester:
| Location | Average Price | Annual Growth | Time to Sell |
|---|---|---|---|
| Manchester | £224,700 | 1.9% | 35 days |
| Wigan | £175,800 | 4.4% | 32 days |
| Liverpool | £177,400 | 3.0% | 34 days |
| Carlisle | £184,500 | 3.8% | 31 days |
Source: Market data compiled from regional analysis[1][3]
These figures reveal affordability-driven demand in Northern markets. Properties in Wigan, Liverpool, and Carlisle offer substantial value compared to Southern equivalents, attracting first-time buyers, investors, and relocating professionals seeking better quality of life.
Southern Stagnation: Identifying the Challenges
The contrast with Southern England couldn't be starker. London's -1.2% annual decline with average prices at £553,258[3] reflects affordability constraints, remote working patterns, and shifting demographic preferences. The South East manages only 1.0% growth at £381,369, while the South West achieves 1.9% at £306,045[1][3].
Coastal Southern markets face particular challenges:
- Canterbury: -1.2% growth, 59 days average time to sell, 18% of inventory over 6 months old[1]
- Torquay: -1.9% growth, 51 days to sell
- Brighton: -1.1% growth, 29% of properties with price reductions exceeding 5%[1]
Paula Higgins, CEO of the HomeOwners Alliance, confirmed in February 2026 that "the current north-south divide in house price growth in England is expected to persist with higher growth in the north of England than in the south"[3]. This authoritative assessment underscores the structural nature of regional divergence rather than temporary fluctuation.
Broader UK Context: Scotland and Northern Ireland
Understanding Valuing Northern England Properties in 2026: Chartered Surveyor Strategies Amid Price Surges and Southern Stagnation requires acknowledging the broader "Northern" phenomenon. Scotland demonstrates 4.9% annual growth with average prices at £191,000[2], while Northern Ireland leads the UK at 7.1% with averages of £193,247[3].
Scottish performance varies by locality:
- Falkirk and Kirkcaldy: 4.2%
- Inverness: 3.5%
- Glasgow: 3.0%[1]
This comprehensive Northern strength—from Northern Ireland through Scotland to Northern England—reflects fundamental economic rebalancing, improved infrastructure investment, and lifestyle migration patterns accelerated by hybrid working arrangements.
Chartered Surveyor Valuation Strategies for Northern Properties
RICS Red Book Compliance in Divergent Markets
Chartered surveyors conducting valuations in 2026 must navigate RICS Valuation – Global Standards (the Red Book) while accounting for unprecedented regional variation. The Red Book requires valuers to adopt appropriate methodology, gather sufficient market evidence, and provide transparent assumptions—all of which become more complex when comparable sales span dramatically different market conditions.
Key RICS principles for Northern England valuations include:
✅ Market Value definition consistency – Applying the "price that would be agreed between a willing buyer and willing seller" requires understanding that Northern markets demonstrate higher transaction velocity and lower negotiation friction
✅ Comparable evidence selection – Prioritizing recent sales (within 3-6 months) from the specific Northern sub-region rather than relying on outdated or geographically distant comparables
✅ Assumption transparency – Clearly documenting market condition assumptions, particularly regarding continued Northern growth trajectories versus Southern stagnation
✅ Special assumptions disclosure – Identifying when valuations assume future market conditions (e.g., anticipated interest rate cuts) that may affect property values
For professional valuation services that incorporate these RICS standards, chartered surveyors must demonstrate rigorous methodology and comprehensive market knowledge.
Comparable Sales Methodology in High-Growth Markets
Selecting appropriate comparables represents the most critical challenge when valuing Northern England properties experiencing rapid appreciation. Traditional comparable sales analysis relies on recent transactions of similar properties in the same locality, but Northern market velocity creates specific complications:
Time adjustment factors become essential. A property sold six months ago in a market appreciating at 4.6% annually requires upward adjustment of approximately 2.3% to reflect current values. Chartered surveyors must apply these adjustments systematically:
- Identify base comparable – Recent sale of similar property type, size, condition
- Calculate time differential – Months between comparable sale and valuation date
- Apply growth rate adjustment – Using regional annual growth rate (4.1-4.6% for Northern England)[2]
- Adjust for property-specific factors – Condition, location micro-factors, unique features
Location hierarchy matters significantly in Northern markets. A Manchester city center apartment operates in a different sub-market than suburban Wigan, despite both being in the North West. Surveyors must establish comparable hierarchies:
- Primary comparables: Same postcode sector, sold within 3 months, similar property type
- Secondary comparables: Adjacent postcode sectors, sold within 6 months, similar type with adjustments
- Tertiary comparables: Broader regional sales, used for market trend validation only
The faster transaction times in Northern markets—31-32 days versus 51-59 days in the South[1]—indicate stronger demand and less price negotiation. This affects valuation confidence levels and the appropriate range of values to report.
Addressing Inventory Age and Price Reduction Patterns
Northern England properties demonstrate healthier inventory turnover compared to Southern markets. Only 9-10% of Northern listings remain unsold after six months, versus 18% in Canterbury[1]. This inventory health indicates robust demand and supports valuation confidence.
Price reduction analysis provides crucial market insight:
| Region | Properties with >5% Price Cuts |
|---|---|
| North West London | 39% |
| South West London | 36% |
| Brighton | 29% |
| Northern England | 9-19% |
| Northern Scotland | 5-8% |
Source: Regional market analysis[1]
When valuing Northern properties, lower price reduction rates suggest that initial asking prices align more closely with achievable market values. Chartered surveyors can therefore place greater confidence in recent listing prices as market indicators, though actual transaction evidence remains paramount.
Understanding average price reductions after survey helps surveyors anticipate negotiation patterns and provide realistic valuation ranges to clients.
Advanced Valuation Techniques for 2026 Market Conditions
Rental Yield Analysis and Investment Valuations
The dramatic divergence in rental inflation between North and South creates opportunities for investment-focused valuations. The North East demonstrates 8.0% annual private rent inflation as of January 2026, while London manages only 1.1%[2]. This rental performance differential affects investment property valuations significantly.
Gross rental yield calculations for Northern properties often exceed Southern equivalents:
Northern England Example (Liverpool):
- Average property price: £177,400
- Average annual rent: £10,200 (estimated from 3.0% price growth and rental demand)
- Gross yield: 5.75%
Southern England Example (Brighton):
- Average property price: £320,000 (estimated from regional data)
- Average annual rent: £14,400
- Gross yield: 4.50%
For investors seeking income generation, Northern properties offer superior yield profiles alongside capital appreciation potential. Chartered surveyors conducting investment valuations must incorporate these yield differentials into their analysis, particularly for SIPP pension valuations where rental income forms a critical component.
Interest Rate Sensitivity and Affordability Modeling
The Bank of England's expected further rate cuts in 2026[3] disproportionately benefit Northern markets where affordability constraints are less severe. Chartered surveyors must model interest rate sensitivity when providing forward-looking valuations or development appraisals.
Affordability calculation framework:
💷 Mortgage affordability = (Annual household income × Income multiple) – Deposit
With Northern England average prices ranging from £175,800 to £224,700[1], a household earning £50,000 annually can access properties with a 4.5x income multiple (£225,000 lending capacity) plus modest deposit. This affordability supports continued demand growth.
Interest rate reduction impacts:
- 0.25% rate cut = approximately £30-40 monthly payment reduction on £200,000 mortgage
- Improved affordability = expanded buyer pool = sustained price support
Surveyors valuing Northern development sites or conducting land value calculations must incorporate these affordability dynamics into residual valuation models.
Market Condition Adjustments and Future Growth Assumptions
Overall UK house price forecast for 2026 projects approximately 2.5% growth in Q4 2026, with the Midlands and North expected to lead[3]. Chartered surveyors must decide whether to incorporate growth assumptions into current valuations or report current market value with separate growth commentary.
RICS guidance on growth assumptions:
⚠️ Market Value reflects current conditions without speculative future growth
⚠️ Special Assumptions may incorporate assumed future conditions if clearly disclosed
⚠️ Investment Value may reflect specific investor expectations including growth forecasts
When valuing Northern properties for mortgage lending purposes, conservative current market value without growth assumptions remains appropriate. However, for investment acquisitions or development appraisals, incorporating regional growth forecasts (4.1-4.6% for Northern England)[2] provides essential decision-making information.
Technology Integration: Data Analytics and Valuation Tools
Modern chartered surveyors leverage advanced data analytics to enhance valuation accuracy in volatile markets. Technology integration includes:
🔧 Automated Valuation Models (AVMs) – Algorithmic price estimates based on comparable sales, adjusted for Northern market conditions
🔧 Geospatial analysis – Mapping price gradients across Northern regions to identify micro-market variations
🔧 Predictive analytics – Machine learning models incorporating economic indicators, transaction velocity, and inventory levels
🔧 Drone surveys – Comprehensive property condition assessment using premium drone surveys for large or complex Northern properties
While technology enhances efficiency, professional judgment remains irreplaceable. Chartered surveyors must interpret data outputs within local market context, recognizing that Northern England's unique dynamics may not align with national algorithmic assumptions.
Regional Variations Within Northern England Markets

Manchester and Greater Manchester: The Economic Engine
Manchester's position as Northern England's economic powerhouse creates distinct valuation considerations. At £224,700 average price with 1.9% annual growth[1], Manchester demonstrates relative maturity compared to surrounding areas. However, this masks significant intra-city variation:
City center apartments – Strong rental demand from young professionals, yields 5-6%, rapid appreciation in premium developments
Suburban family homes – Steady demand from relocating families, larger properties, school catchment premiums
Regeneration zones – Speculative growth potential, higher risk-reward profile, requires careful comparable selection
Surveyors valuing Manchester properties must segment by micro-market rather than applying city-wide averages. A Spinningfields apartment operates in an entirely different market than a Wigan terraced house, despite both being in Greater Manchester.
Liverpool and Merseyside: Value and Regeneration
Liverpool's £177,400 average price with 3.0% growth[1] positions it as a value proposition within Northern England. The city's ongoing regeneration, cultural assets, and improving transport connectivity support medium-term appreciation potential.
Valuation considerations for Liverpool properties:
- Waterfront developments – Premium pricing, strong rental demand, tourism-adjacent benefits
- Georgian Quarter – Heritage property premiums, conservation area restrictions, specialist buyer market
- Suburban areas – Family-oriented demand, school quality premiums, transport link sensitivity
The 34-day average time to sell[1] indicates healthy market velocity, supporting valuation confidence. However, surveyors must distinguish between established neighborhoods and emerging areas where comparable evidence may be limited.
Yorkshire and Humber: Diverse Market Dynamics
While specific Yorkshire data wasn't detailed in the research sources, the region's diverse economic base—from Leeds' financial services to Sheffield's advanced manufacturing—creates varied property market dynamics. Chartered surveyors operating across Yorkshire must recognize:
✓ Leeds – Strong professional employment, city center apartment demand, commuter belt family housing
✓ Sheffield – Affordability advantages, student rental market, regeneration opportunities
✓ York – Tourism economy, heritage property premiums, restricted development supply
Each Yorkshire sub-market requires tailored comparable selection and distinct growth assumptions based on local economic drivers.
North East: Leading Growth Requires Careful Analysis
The North East's 4.6% annual growth[2]—England's highest—demands particular attention from chartered surveyors. Newcastle upon Tyne's 31-day average time to sell[1] indicates strong demand, but this regional leadership raises questions:
❓ Is growth sustainable or approaching cyclical peak?
❓ What economic fundamentals support continued appreciation?
❓ How should comparables be adjusted in rapidly appreciating markets?
Surveyors must balance current market evidence with prudent growth assumptions, particularly for mortgage lending valuations where conservative approaches protect lender interests. Understanding regional economic development, employment trends, and infrastructure investment provides essential context for professional judgment.
Practical Implementation: Valuing Northern England Properties in 2026
Step-by-Step Valuation Framework
Valuing Northern England Properties in 2026: Chartered Surveyor Strategies Amid Price Surges and Southern Stagnation requires systematic methodology:
1. Define valuation purpose and basis
- Mortgage lending (conservative market value)
- Investment acquisition (may include growth assumptions)
- Insurance reinstatement (replacement cost basis)
- Taxation or accounting (specific regulatory requirements)
2. Conduct property inspection
- Physical condition assessment
- Identify value-affecting features (extensions, improvements, defects)
- Document with photographs and measurements
- Note location-specific factors (views, noise, accessibility)
3. Research comparable sales evidence
- Prioritize sales within 3-6 months in same postcode sector
- Expand geographically if insufficient local evidence
- Apply time adjustments for market appreciation (4.1-4.6% annually)[2]
- Adjust for property-specific differences
4. Analyze current market conditions
- Review inventory levels and time-to-sell data
- Assess price reduction patterns (9-19% in Northern England)[1]
- Consider economic indicators (employment, wages, interest rates)
- Incorporate regional growth forecasts where appropriate[3]
5. Apply valuation methodology
- Comparable sales approach (primary method for residential)
- Income capitalization (for investment properties using rental yields)
- Cost approach (for unique properties or insurance valuations)
6. Reconcile value indicators and report
- Synthesize evidence into value conclusion
- Provide value range if appropriate
- Document assumptions and limitations
- Ensure RICS Red Book compliance
For complex properties or specialized purposes, engaging experienced professionals such as those offering comprehensive building surveys ensures thorough analysis.
Common Valuation Challenges and Solutions
Challenge 1: Limited comparable evidence in emerging Northern areas
Solution: Expand geographic search radius while applying location adjustments; consider new-build pricing as secondary evidence; use rental yield analysis to cross-check capital values
Challenge 2: Rapid price appreciation creates outdated comparables
Solution: Apply systematic time adjustments using regional growth rates[2]; weight recent evidence more heavily; consider pending sales (under offer) as market indicators
Challenge 3: Southern-based valuation models don't reflect Northern dynamics
Solution: Develop region-specific valuation databases; adjust algorithmic outputs using local professional judgment; engage Northern-based surveyors with local market expertise
Challenge 4: Investment clients expect growth assumptions
Solution: Provide current market value as primary opinion; offer separate growth scenario analysis with clearly stated assumptions; reference authoritative forecasts[3] as supporting evidence
Quality Assurance and Professional Standards
Maintaining valuation quality in dynamic markets requires robust quality assurance:
📋 Peer review processes – Second surveyor reviews significant or complex valuations
📋 Comparable evidence verification – Confirm transaction prices through multiple sources
📋 Assumption documentation – Clearly record all assumptions and limitations
📋 Market knowledge updates – Regular review of regional market reports and economic data
📋 Professional development – Ongoing training in RICS standards and regional market dynamics
The RICS professional standards provide essential guidance for maintaining competence and ethical practice across all valuation activities.
Future Outlook: Sustaining Accuracy Amid Continued Divergence
2026 Forecast Implications for Valuations
The 2.5% overall UK growth forecast for Q4 2026[3] masks continued regional divergence. Chartered surveyors must anticipate:
🔮 Persistent North-South divide – Paula Higgins' confirmation that divergence will persist[3] suggests multi-year structural shift rather than temporary anomaly
🔮 Interest rate sensitivity – Further Bank of England rate cuts[3] will disproportionately benefit Northern affordability, supporting continued demand
🔮 Wage growth impact – Steady wage growth[3] combined with lower Northern property prices expands the buyer pool
🔮 Migration patterns – Continued lifestyle migration from expensive Southern areas to affordable Northern regions
These trends suggest sustained Northern strength rather than speculative bubble, supporting confident valuations based on fundamental demand drivers.
Risk Factors and Scenario Planning
Professional valuers must also consider downside risks to Northern market performance:
⚠️ Economic recession – National or regional economic downturn could dampen demand
⚠️ Interest rate volatility – Unexpected rate increases would affect mortgage affordability
⚠️ Oversupply risk – Excessive new development could saturate local markets
⚠️ Employment concentration – Cities dependent on single industries face sector-specific risks
Scenario planning for significant valuations should incorporate:
- Base case: Continued 4.1-4.6% Northern growth[2]
- Optimistic case: Accelerated growth if Southern buyers relocate in greater numbers
- Conservative case: Moderation to 2-3% growth aligned with national averages
This range-based approach provides clients with realistic expectations while maintaining professional prudence.
Adapting to Market Evolution
As 2026 progresses, chartered surveyors must remain agile and informed:
✅ Monitor monthly market data – Track regional price indices, transaction volumes, inventory levels
✅ Engage local networks – Maintain relationships with estate agents, developers, lenders in Northern markets
✅ Update comparable databases – Continuously refresh transaction evidence to reflect current conditions
✅ Refine methodologies – Adjust time correction factors and location adjustments based on emerging trends
✅ Communicate transparently – Provide clients with clear explanations of market dynamics and valuation rationale
The most successful valuers will be those who combine rigorous methodology with deep local market knowledge, recognizing that Northern England's diverse markets require nuanced, location-specific approaches rather than one-size-fits-all formulas.
Conclusion
Valuing Northern England Properties in 2026: Chartered Surveyor Strategies Amid Price Surges and Southern Stagnation represents both a challenge and an opportunity for property professionals. The unprecedented regional divergence—with Northern England achieving 4.1-4.6% annual growth while London contracts at -1.2%[2][3]—demands sophisticated valuation approaches that recognize distinct market dynamics, apply rigorous comparable sales methodology, and maintain strict RICS Red Book compliance.
Chartered surveyors must navigate faster transaction times (31-32 days in Northern markets versus 51-59 days in the South)[1], lower price reduction rates (9-19% versus 29-39%)[1], and superior rental yield profiles (8.0% rent inflation in the North East versus 1.1% in London)[2]. These factors collectively indicate fundamental market strength rather than speculative excess, supporting confident valuations based on solid economic fundamentals.
The path forward requires continuous professional development, robust quality assurance, and transparent communication with clients about market conditions and valuation assumptions. As Paula Higgins confirmed, the North-South divide is expected to persist[3], making regional expertise increasingly valuable.
Actionable Next Steps
For property professionals, investors, and homeowners navigating Northern England's dynamic market:
- Engage qualified chartered surveyors with demonstrated Northern market expertise and current RICS accreditation
- Request detailed comparable evidence showing recent transactions, time adjustments, and location-specific factors
- Understand valuation assumptions including growth forecasts, interest rate expectations, and market condition assessments
- Monitor regional economic indicators including employment trends, wage growth, and infrastructure investment
- Consider professional valuations for all significant property decisions, from purchases to refinancing to investment analysis
The Northern England property market of 2026 offers compelling opportunities for those equipped with accurate valuations, professional guidance, and strategic insight. By combining rigorous methodology with deep local knowledge, chartered surveyors provide the essential foundation for confident property decisions in this era of regional transformation.
References
[1] Where House Prices Are Expected To Rise And Fall Most In 2026 – https://bebeez.eu/2026/01/13/where-house-prices-are-expected-to-rise-and-fall-most-in-2026/
[2] February2026 – https://www.ons.gov.uk/economy/inflationandpriceindices/bulletins/privaterentandhousepricesuk/february2026
[3] House Price Forecast – https://hoa.org.uk/advice/guides-for-homeowners/i-am-buying/house-price-forecast/
[4] House Prices – https://moneyweek.com/investments/house-prices/house-prices