The UK property market in 2026 presents a fascinating paradox: while Northern regions experience unprecedented growth and transformation, Southern markets show remarkable stability. For chartered surveyors and property professionals, Navigating 2026 Regional Valuation Variations: Surveyor Tools for North-South Price Shifts has become essential to delivering accurate, defensible valuations that reflect these divergent market conditions.
The challenge lies not just in recognizing these regional differences but in applying the right tools and methodologies to quantify them. With modern AI valuation platforms now incorporating multiple data layers—transaction data, behavioral trends, economic indicators, location intelligence, and property-level features—valuations adjust dynamically rather than annually or quarterly[1]. This technological evolution, combined with RICS best practices, provides surveyors with unprecedented capabilities to navigate complex regional variations.
Key Takeaways
- Regional adjustment matrices are essential for comparing Northern growth markets against stable Southern areas, with location premiums varying by up to 15-20% between regions
- AI-powered valuation tools now integrate multiple data layers including climate risk and ESG metrics, enabling hyperlocal market analysis[1]
- Advanced surveying equipment like RTK GNSS systems delivers centimeter-level accuracy for boundary documentation and property assessment[4]
- RICS best practices require transparent documentation of all regional adjustments and comparable selection criteria
- Dynamic valuation models replace static annual updates, providing real-time market intelligence for North-South price variations[1]
Understanding the 2026 North-South Property Divide 🏘️

The geographical property price divide between Northern and Southern England has evolved significantly in 2026. While traditional wisdom positioned London and the South East as premium markets, recent economic shifts have created new dynamics that surveyors must understand.
Current Market Characteristics
Northern Markets show characteristics of growth and transformation:
- Increased investment in infrastructure and regeneration
- Growing tech and creative sectors attracting younger demographics
- Price growth rates exceeding 8-12% annually in key cities
- Higher transaction volumes indicating market liquidity
- Emerging micro-markets with distinct valuation profiles
Southern Markets demonstrate stability and maturity:
- Established price points with 2-4% annual appreciation
- Lower volatility and predictable seasonal patterns
- Premium positioning maintained through scarcity
- Slower transaction velocity but higher absolute values
- Well-documented historical comparables
For chartered surveyors across London, understanding these divergent patterns is crucial for accurate property assessments.
Economic Drivers Behind Regional Variations
Several factors contribute to the 2026 regional divide:
| Factor | Northern Impact | Southern Impact |
|---|---|---|
| Employment Growth | High (tech, creative, manufacturing) | Moderate (services, finance) |
| Infrastructure Investment | Significant (HS2, transport links) | Incremental improvements |
| Housing Supply | Expanding rapidly | Constrained by planning |
| Affordability | Improving relative to wages | Challenging for first-time buyers |
| Migration Patterns | Net inward from South | Outward to surrounding counties |
"The Northern property renaissance isn't just about lower prices—it's about fundamental economic restructuring that creates genuine value appreciation opportunities." – RICS Regional Markets Report 2026
Essential Surveyor Tools for Navigating 2026 Regional Valuation Variations 🔧
Successfully Navigating 2026 Regional Valuation Variations: Surveyor Tools for North-South Price Shifts requires both technological sophistication and methodological rigor. Modern surveyors deploy an integrated toolkit combining traditional expertise with cutting-edge technology.
AI-Powered Valuation Platforms
Automated Valuation Models (AVMs) have evolved dramatically, now detecting micro-market shifts and analyzing hyperlocal demand with unprecedented accuracy[1]. These platforms offer several advantages:
Multi-Layer Data Integration
- Transaction databases updated in real-time
- Behavioral trend analysis from property portal activity
- Economic indicators at postcode level
- Location intelligence including transport accessibility
- Property-level features from planning databases
Dynamic Adjustment Capabilities
- Real-time market condition factors
- Seasonal variation algorithms
- Supply-demand equilibrium modeling
- Comparable selection optimization
- Confidence interval calculations
However, rural and low-transaction areas still present accuracy challenges[1], requiring human expertise to validate AI-generated valuations. Professional valuation services combine technological tools with experienced judgment.
Advanced Surveying Equipment
Physical property assessment benefits from technological advances in measurement and documentation:
RTK GNSS Systems
Modern Real-Time Kinematic Global Navigation Satellite Systems offer centimeter-level accuracy for property boundary documentation and cadastral planning[4]. Key features include:
- Multi-constellation tracking (GPS, GLONASS, BeiDou, Galileo)[4]
- Tilt compensation for challenging terrain
- Real-time data transmission to cloud platforms
- Integration with CAD and GIS software
- Enhanced accuracy in urban canyon environments
Total Stations and Laser Scanners
These tools provide comprehensive spatial data:
- 3D point cloud generation for complex structures
- Precise elevation and gradient measurements
- Digital twin creation for property documentation
- Integration with Building Information Modeling (BIM)
- Remote measurement capabilities
Climate Risk and ESG Integration
AI valuation systems increasingly integrate climate risk and ESG metrics, analyzing flood risk zones, heat exposure data, and energy efficiency ratings[1]. This integration is particularly relevant for regional variations:
Northern Properties: Often benefit from:
- Lower flood risk in many areas
- Modern construction with better energy efficiency
- Opportunities for sustainable development
- Lower heat island effects
Southern Properties: May face:
- Higher coastal and river flood exposure
- Older building stock requiring retrofitting
- Heat stress in urban areas
- Premium for existing green credentials
For comprehensive property assessments, commercial valuations now routinely incorporate these environmental factors.
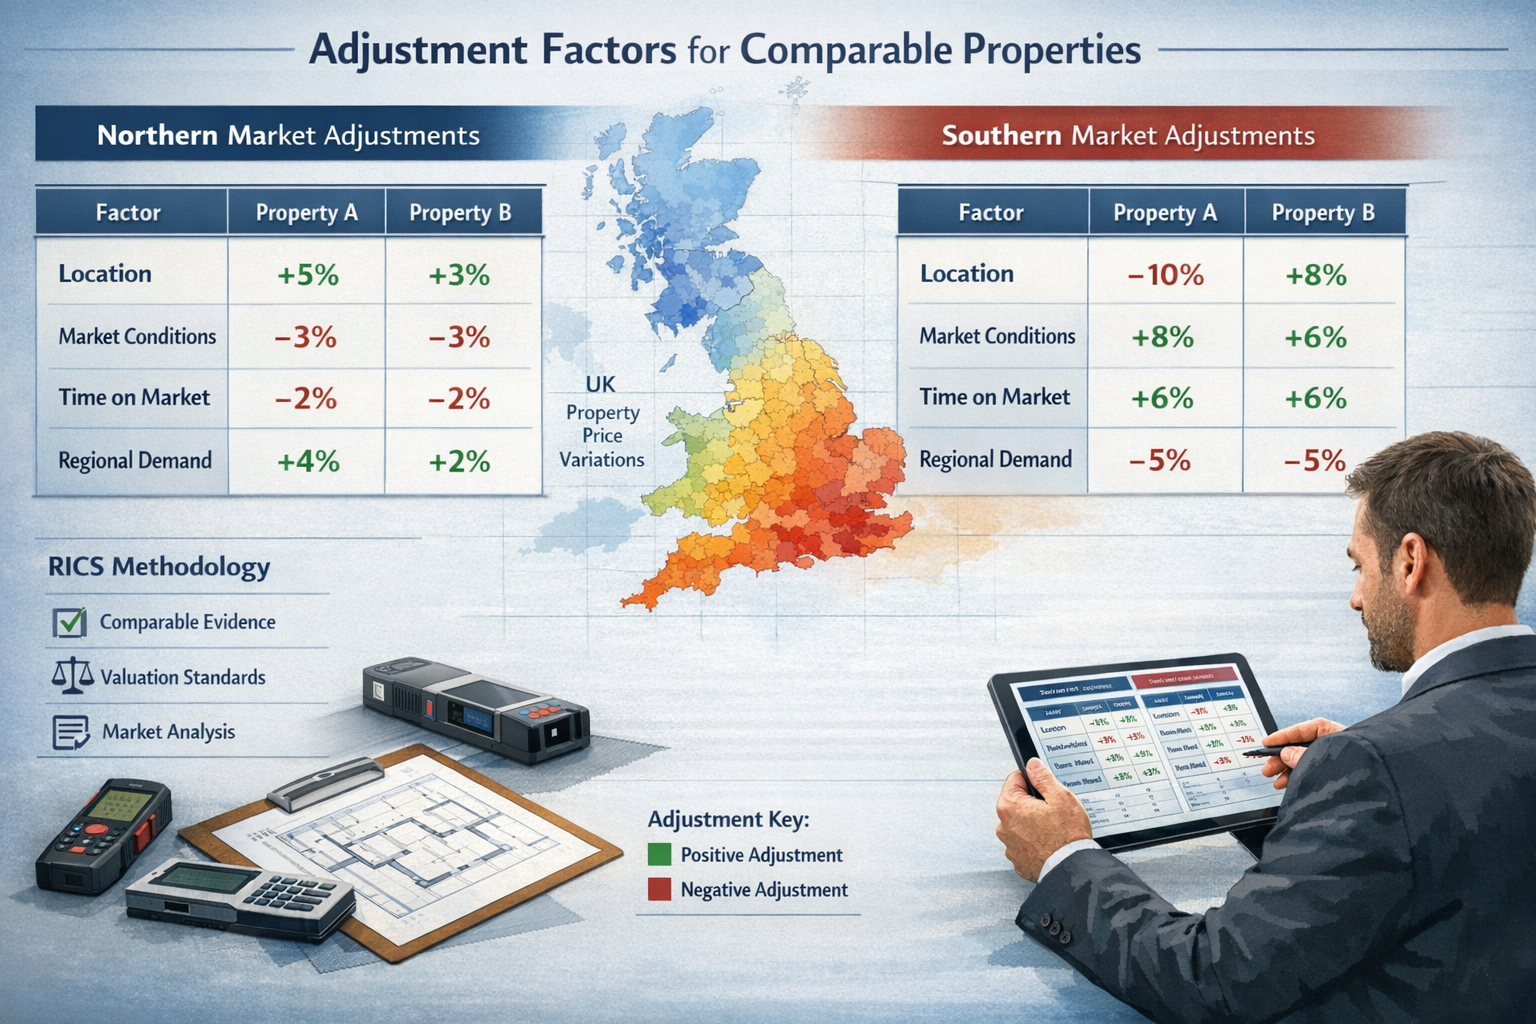
Adjustment Matrices for North-South Comparable Analysis 📊
The heart of Navigating 2026 Regional Valuation Variations: Surveyor Tools for North-South Price Shifts lies in developing robust adjustment matrices that account for regional differences while maintaining RICS compliance.
RICS Best Practices for Regional Adjustments
The Royal Institution of Chartered Surveyors provides clear guidance on comparable analysis:
Core Principles:
- Transparency: All adjustments must be documented and justified
- Consistency: Apply methodologies uniformly across properties
- Market Evidence: Base adjustments on actual transaction data
- Professional Judgment: Combine quantitative data with expert insight
- Verification: Cross-check results against multiple sources
Building Effective Adjustment Matrices
A comprehensive matrix for regional variations should address multiple factors:
Location Adjustment Framework
Primary Location Factors (±10-20% adjustment range):
| Adjustment Category | Northern Markets | Southern Markets | Typical Variance |
|---|---|---|---|
| Regional Premium | -5% to +5% | +10% to +20% | 15-25% differential |
| Micro-location | -10% to +15% | -5% to +25% | Highly variable |
| Transport Links | +5% to +20% | +3% to +15% | Infrastructure dependent |
| School Catchment | +5% to +15% | +10% to +30% | Quality dependent |
| Amenity Access | +3% to +10% | +5% to +12% | Urban vs. rural |
Secondary Location Factors (±5-10% adjustment range):
- Neighborhood reputation and demographics
- Crime rates and safety perception
- Green space and environmental quality
- Future development plans
- Historical price trends
For properties in specific areas like South West London or North West London, micro-location factors can significantly impact valuations.
Market Condition Adjustments
Growing Northern Markets require specific considerations:
Time Adjustments:
- Monthly appreciation rates: 0.5-1.0% in hot markets
- Quarterly review of comparable validity
- Seasonal variation: typically lower than Southern markets
- New build premium: 5-10% over comparable resale
Market Velocity Factors:
- Days on market: 30-45 days (strong market indicator)
- Sale-to-list price ratio: 98-102% (competitive markets)
- Multiple offer scenarios: +2-5% premium
- Cash buyer prevalence: varies by segment
Stable Southern Markets show different patterns:
Time Adjustments:
- Monthly appreciation rates: 0.2-0.4% (steady growth)
- Annual review cycles often sufficient
- Pronounced seasonal variation: spring premium 3-7%
- Established property premium: heritage value
Market Velocity Factors:
- Days on market: 60-90 days (normal conditions)
- Sale-to-list price ratio: 95-98% (negotiation expected)
- Price stickiness: sellers less motivated to discount
- International buyer influence: significant in prime areas
Physical Property Adjustment Matrix
Beyond location and market conditions, physical characteristics require standardized adjustments:
Condition and Quality (±15-25% range):
| Feature | Excellent | Good | Average | Poor | Adjustment Impact |
|---|---|---|---|---|---|
| Overall Condition | +10-15% | +5% | Baseline | -10-20% | High |
| Kitchen Quality | +5-8% | +2-3% | Baseline | -5-10% | Medium |
| Bathroom Count/Quality | +3-7% | +1-3% | Baseline | -3-8% | Medium |
| Energy Efficiency | +5-10% | +2-4% | Baseline | -5-12% | Increasing |
| Period Features | +5-15% | +2-5% | N/A | N/A | Market dependent |
Size and Configuration (±10-20% range):
- Square footage: £/sqft varies dramatically by region
- Room count and layout efficiency
- Outdoor space: premium higher in urban areas
- Parking provision: essential in some markets
- Storage and utility spaces
Practical Application Example
Case Study: Comparable Adjustment
Subject Property: 3-bedroom semi-detached house in Manchester (Northern market)
Comparable: Similar property in Surrey (Southern market)
Base Adjustment Matrix:
Comparable Sale Price (Surrey): £550,000
Regional Location Adjustment: -18% (£99,000)
Market Condition Adjustment: +8% (Northern growth) (£36,080)
Time Adjustment (6 months): +4% (£18,040)
Condition Adjustment: -5% (comparable superior) (£24,250)

Adjusted Comparable Value: £480,870
Subject Property Indicated Value: £475,000-£485,000
This systematic approach ensures defensible valuations that account for regional variations while maintaining professional standards. For specialized purposes like capital gains valuations, precise adjustment documentation is essential.
Technology Integration and Data Management 💻
Effective Navigating 2026 Regional Valuation Variations: Surveyor Tools for North-South Price Shifts depends on sophisticated data management and technology integration.
Data Sources and Verification
Primary Data Sources:
- Land Registry transaction records
- Property portal listing data (Rightmove, Zoopla)
- Local authority planning databases
- RICS comparable databases
- Proprietary valuation networks
- Economic indicators (ONS, regional development agencies)
Data Quality Protocols:
- Verification: Cross-reference multiple sources
- Currency: Prioritize recent transactions (3-6 months)
- Relevance: Geographic and property type matching
- Completeness: Ensure full transaction details
- Outlier Detection: Identify and investigate anomalies
Software Solutions for Regional Analysis
Modern valuation software offers specialized features for regional variation analysis:
Key Capabilities:
- Automated comparable search with regional filters
- Heat mapping of price variations
- Trend analysis and forecasting tools
- Adjustment calculator with customizable matrices
- Report generation with RICS compliance
- Cloud-based collaboration platforms
Integration Benefits:
- Consistency across multiple valuers
- Audit trail for professional indemnity
- Efficiency gains: 40-60% time reduction
- Real-time market intelligence
- Client portal access for transparency
Mobile Technology for Field Work
Site visits benefit from integrated mobile solutions:
Field Data Capture:
- Tablet-based inspection apps
- Photographic documentation with GPS tagging
- Voice-to-text note-taking
- Measurement tools integration
- Instant comparable access
- Offline functionality for rural areas
Quality Assurance:
- Standardized inspection checklists
- Automatic report population
- Reduced transcription errors
- Faster turnaround times
- Enhanced client communication
For comprehensive property assessments including insurance reinstatement cost valuations, integrated technology ensures accuracy and completeness.
Regional Market Intelligence and Trend Analysis 📈
Understanding current trends is essential for accurate valuations in 2026's dynamic market.
Northern Market Dynamics
Key Growth Drivers:
- Infrastructure Investment: Major transport improvements enhancing connectivity
- Economic Diversification: Tech hubs in Manchester, Leeds, Newcastle
- Affordability Migration: Professionals relocating from Southern markets
- Regeneration Projects: City center transformations attracting investment
- University Expansion: Student accommodation driving rental markets
Emerging Micro-Markets:
Certain Northern areas show exceptional growth:
- Manchester suburbs: 12-15% annual appreciation
- Leeds cultural quarter: 10-13% growth
- Liverpool waterfront: 9-12% increases
- Sheffield tech corridor: 8-11% appreciation
- Newcastle city center: 7-10% growth
Valuation Implications:
- Higher adjustment frequency required
- Greater weight on forward-looking indicators
- New build comparables essential
- Rental yield analysis increasingly relevant
- Development potential premium
Southern Market Characteristics
Stability Factors:
- Established Values: Mature markets with historical precedent
- Scarcity Premium: Planning constraints limiting supply
- International Appeal: Global buyer interest maintaining prices
- Wealth Concentration: High-income demographics supporting values
- Infrastructure Maturity: Established transport and amenities
Price Pressure Points:
- Affordability constraints limiting first-time buyers
- Stamp duty impact on mid-market transactions
- Remote work reducing London premium
- Environmental regulations affecting older stock
- Interest rate sensitivity in premium segments
Valuation Implications:
- Longer comparable validity periods
- Seasonal adjustment significance
- Heritage and character premiums
- School catchment critical importance
- Conservation area impacts
For surveyors working across regions like Sussex or Oxfordshire, understanding these nuanced differences is crucial.
Cross-Regional Investment Analysis
Investors increasingly compare North-South opportunities:
Investment Metrics Comparison:
| Metric | Northern Markets | Southern Markets |
|---|---|---|
| Gross Yield | 5-8% | 3-5% |
| Capital Appreciation | 8-12% annually | 2-4% annually |
| Entry Price | £150-300k typical | £350-600k typical |
| Tenant Demand | High (young professionals) | High (diverse demographics) |
| Void Periods | 2-4 weeks | 1-3 weeks |
| Management Intensity | Moderate | Lower |
Risk-Adjusted Returns:
Northern markets offer higher gross returns but potentially higher volatility, while Southern markets provide stability with lower yields. Sophisticated investors diversify across regions to balance portfolios.
Professional Standards and Compliance ⚖️
Navigating 2026 Regional Valuation Variations: Surveyor Tools for North-South Price Shifts must always align with professional standards and regulatory requirements.
RICS Valuation Standards (Red Book)
The RICS Valuation – Global Standards (Red Book) provides mandatory requirements:
Key Requirements:
- Competence: Valuers must have appropriate regional market knowledge
- Independence: Conflicts of interest must be disclosed and managed
- Transparency: Methodology and assumptions clearly stated
- Basis of Value: Appropriate definition applied (Market Value, Investment Value, etc.)
- Assumptions and Special Assumptions: Explicitly documented
Regional Variation Considerations:
- Comparable evidence must be genuinely comparable
- Regional adjustments require market evidence support
- Uncertainty ranges should reflect market volatility
- Departure from standards must be justified and disclosed
- Regular CPD on regional markets essential
Documentation Requirements
Comprehensive documentation protects both surveyor and client:
Essential Documentation:
- Comparable Schedule: Detailed property descriptions, sale dates, prices
- Adjustment Matrix: All adjustments with supporting rationale
- Market Analysis: Regional trends and conditions assessment
- Inspection Notes: Comprehensive property condition documentation
- Photographs: Exterior, interior, defects, features
- Assumptions: All assumptions and limitations clearly stated
- Verification: Evidence of comparable verification
Digital Record-Keeping:
- Cloud-based storage with backup protocols
- Version control for report iterations
- Secure client data management (GDPR compliance)
- Audit trail for professional indemnity
- Retention periods: minimum 6 years (15 for some purposes)
Professional Indemnity Considerations
Regional valuation variations present specific PI risks:
Risk Factors:
- Rapidly changing markets increasing valuation volatility
- Limited comparable evidence in emerging areas
- Client pressure for optimistic valuations
- Cross-regional comparisons lacking precision
- Technology reliance without human oversight
Risk Mitigation Strategies:
- Conservative approach in uncertain markets
- Wider valuation ranges reflecting uncertainty
- Explicit caveats regarding market volatility
- Regular market intelligence updates
- Peer review for complex valuations
- Appropriate PI insurance coverage levels
For specialized work like SIPP pension valuations, compliance and documentation are particularly critical.
Future-Proofing Regional Valuation Practices 🔮

As markets evolve, surveyors must anticipate future developments in Navigating 2026 Regional Valuation Variations: Surveyor Tools for North-South Price Shifts.
Emerging Technologies
Artificial Intelligence Advancement:
AI-powered property valuation tools continue evolving with enhanced capabilities for analyzing complex regional variations[1]. Future developments include:
- Predictive Analytics: Machine learning models forecasting regional price movements
- Image Recognition: Automated property condition assessment from photographs
- Natural Language Processing: Extracting insights from property descriptions and reports
- Blockchain Integration: Immutable transaction records improving data reliability
- Virtual Reality: Remote property inspections with enhanced detail
Limitations and Human Expertise:
Despite technological advances, human judgment remains essential:
- Contextual understanding of local market nuances
- Qualitative factors not captured in data
- Ethical considerations and professional responsibility
- Client communication and advisory role
- Complex property types requiring specialist knowledge
Climate Change and Environmental Factors
Environmental considerations increasingly impact regional valuations:
Climate Risk Assessment:
- Flood risk mapping and insurance availability
- Coastal erosion and sea level rise impacts
- Heat stress and urban heat island effects
- Extreme weather resilience requirements
- Carbon reduction pathway compliance
ESG Integration:
Environmental, Social, and Governance factors influence property values:
- Energy Performance Certificate (EPC) ratings affecting marketability
- Retrofit requirements for older properties
- Green building certifications commanding premiums
- Social housing obligations in developments
- Governance and planning compliance
Regional Variations:
Climate impacts differ significantly between North and South:
- Southern coastal areas: higher flood and erosion risk
- Northern industrial areas: brownfield remediation opportunities
- Urban centers: heat island mitigation requirements
- Rural areas: agricultural land value shifts
Regulatory Evolution
Anticipated regulatory changes affecting regional valuations:
Planning Reform:
- Simplified planning zones potentially reducing regional disparities
- Increased housing targets in high-demand areas
- Green belt review and potential release
- Permitted development rights expansion
Taxation Changes:
- Potential property tax reforms affecting regional attractiveness
- Capital gains tax modifications impacting investment decisions
- Stamp duty restructuring possibilities
- Inheritance tax planning considerations
Building Standards:
- Enhanced energy efficiency requirements
- Fire safety regulations post-Grenfell
- Accessibility standards evolution
- Structural resilience requirements
Continuous Professional Development
Maintaining expertise in regional variations requires ongoing learning:
Essential CPD Areas:
- Regional market trend analysis and forecasting
- Advanced valuation technology utilization
- Climate risk and ESG assessment methodologies
- Regulatory compliance and standards updates
- Data analytics and statistical techniques
- Professional ethics and risk management
Knowledge Sharing:
- Regional RICS branch participation
- Professional network development
- Conference attendance and presentation
- Published research and case studies
- Mentoring and peer learning
Conclusion
Navigating 2026 Regional Valuation Variations: Surveyor Tools for North-South Price Shifts represents both a significant challenge and tremendous opportunity for property professionals. The divergent trajectories of Northern growth markets and stable Southern areas require sophisticated tools, robust methodologies, and deep market understanding.
Success in this environment depends on several key factors:
✅ Embrace Technology: Leverage AI-powered valuation platforms, advanced surveying equipment, and integrated data management systems while maintaining professional judgment and oversight.
✅ Develop Robust Matrices: Create comprehensive adjustment frameworks that account for regional location premiums, market condition variations, and physical property differences with full RICS compliance.
✅ Maintain Market Intelligence: Stay current with regional trends, economic drivers, and emerging micro-markets through continuous research and professional networking.
✅ Ensure Compliance: Adhere to RICS standards, maintain thorough documentation, and manage professional indemnity risks through conservative approaches and appropriate caveats.
✅ Future-Proof Practices: Anticipate technological evolution, environmental considerations, and regulatory changes while investing in continuous professional development.
Actionable Next Steps
For surveyors and property professionals seeking to enhance their regional valuation capabilities:
- Audit Current Tools: Evaluate existing technology stack and identify gaps in regional analysis capabilities
- Develop Regional Expertise: Focus on specific geographic markets to build deep knowledge and comparable databases
- Create Adjustment Templates: Build standardized matrices for common property types and regional comparisons
- Invest in Training: Pursue CPD opportunities in AI valuation tools, climate risk assessment, and regional market analysis
- Build Networks: Establish relationships with local agents, developers, and fellow surveyors across regions
- Document Best Practices: Create internal protocols for regional variation analysis and quality assurance
- Review Insurance: Ensure professional indemnity coverage adequately reflects cross-regional valuation risks
The UK property market's regional variations present complexity, but with the right tools, methodologies, and expertise, surveyors can deliver accurate, defensible valuations that serve clients effectively while maintaining the highest professional standards. Whether working in South East London or emerging Northern markets, the principles of rigorous analysis, transparent methodology, and continuous learning remain constant.
By combining traditional surveying expertise with modern technology and comprehensive market intelligence, property professionals can confidently navigate the North-South divide and provide exceptional value to clients in 2026 and beyond.
References
[1] Ai Powered Property Valuation Tools 2026 – https://www.coradvisors.net/2026/02/ai-powered-property-valuation-tools-2026.html?m=1
[2] Valuation Tools – https://www.nar.realtor/appraisal-valuation/valuation-tools
[3] Real Estate Market Analysis Tools – https://www.saleswise.ai/blog/real-estate-market-analysis-tools
[4] Land Surveying – https://emlid.com/land-surveying/
[5] Navigating The 2026 Land Survey Equipment Boom Total Stations Gps And Laser Scanners Reviewed – https://nottinghillsurveyors.com/blog/navigating-the-2026-land-survey-equipment-boom-total-stations-gps-and-laser-scanners-reviewed
[6] Emerging Trends In Real Estate United States And Canada 2026 – https://knowledge.uli.org/en/reports/emerging-trends/2026/emerging-trends-in-real-estate-united-states-and-canada-2026