The surveying profession has witnessed a seismic shift in how deliverables are created, shared, and consumed. Not long ago, clients received thick printed reports bound in folders, followed by email attachments containing static PDF files. Today, from static PDFs to interactive dashboards: how cloud-based survey platforms are changing client expectations represents more than a technological upgrade—it's a fundamental transformation in how stakeholders access, collaborate on, and derive value from survey data. Modern clients now expect real-time access to browser-based 3D models, integrated communication tools, and on-demand analytics that make traditional static reports feel antiquated.
This evolution mirrors broader changes across industries where instant access and collaborative capabilities have become standard. The surveying sector, traditionally conservative in adopting new technologies, now finds itself at the forefront of digital transformation, driven by client demands for transparency, speed, and actionable insights.
Key Takeaways
✅ Real-time accessibility has replaced waiting: Cloud-based platforms provide instant access to survey data through interactive dashboards that update automatically, eliminating delays associated with PDF report generation and distribution.
✅ Collaboration is now embedded: Modern survey platforms include built-in communication tools, annotation features, and role-based access controls that enable teams to discuss findings within the platform rather than through separate email chains.
✅ Self-service analytics empower clients: Drag-and-drop interfaces and natural language querying allow non-technical stakeholders to explore survey data independently without requiring specialized training or analyst support.
✅ Mobile access is expected, not optional: Full-featured native apps enable stakeholders to view interactive 3D models and dashboards on smartphones and tablets, fundamentally changing when and where survey data can be accessed.
✅ Integration capabilities drive efficiency: Modern platforms connect to hundreds of data sources, allowing survey information to integrate seamlessly with project management, BIM software, and business intelligence tools.
The Evolution of Survey Deliverables: From Paper to Cloud

The Era of Static Reporting
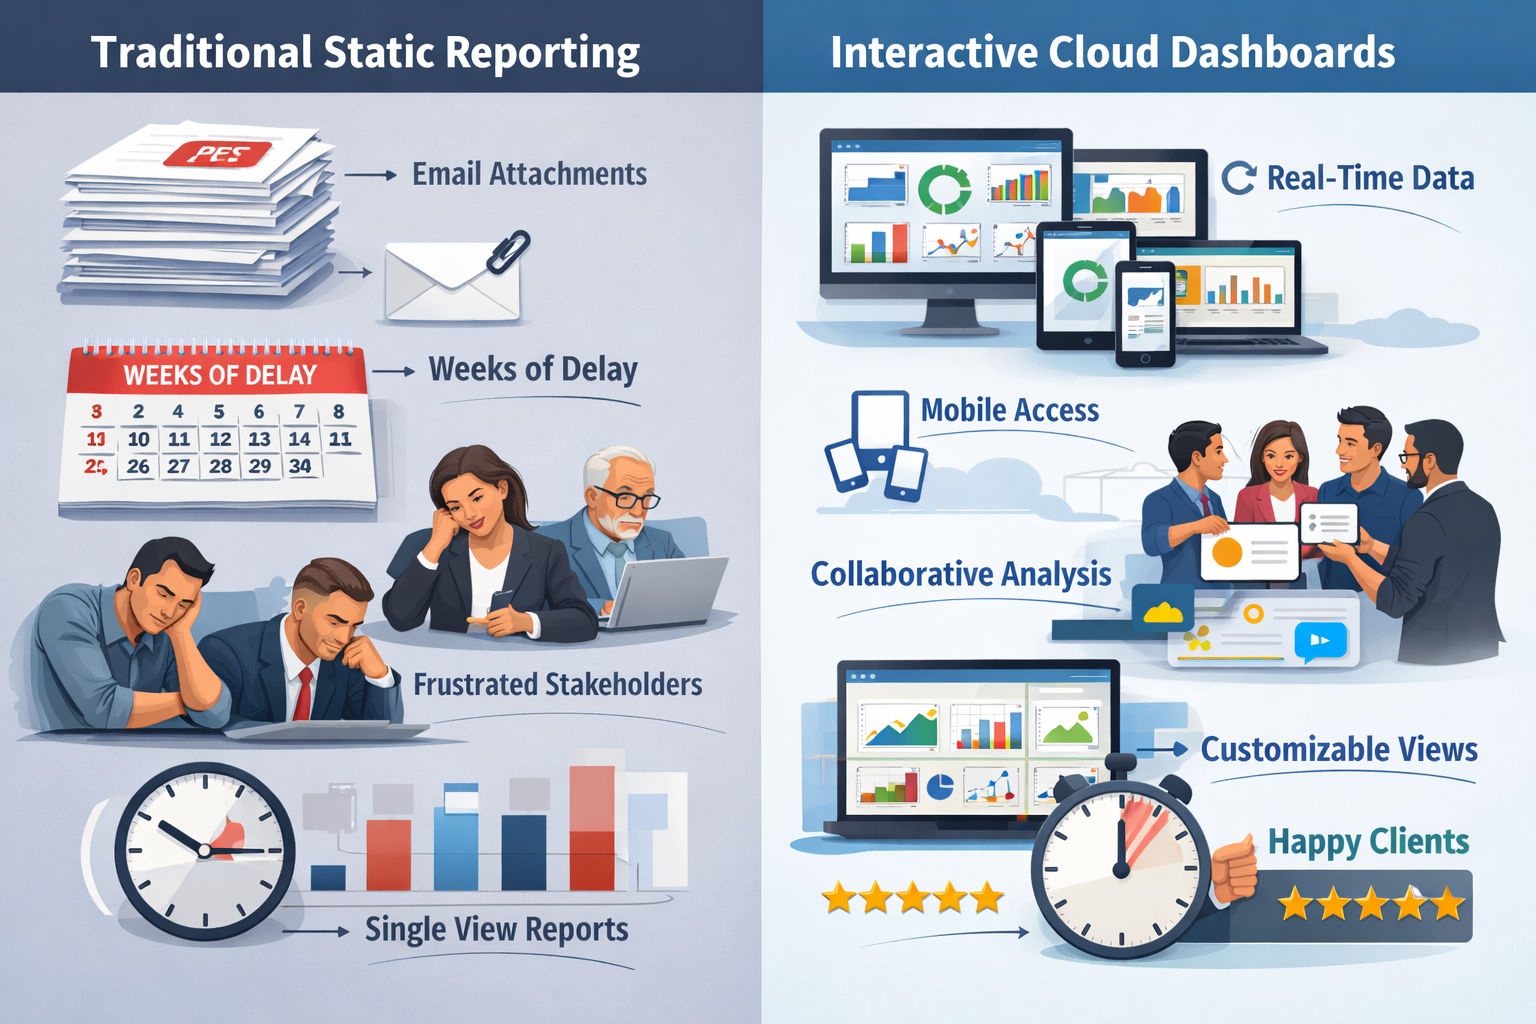
Traditional surveying deliverables followed a predictable pattern: field teams collected measurements, returned to the office, processed data manually, created technical drawings, compiled findings into comprehensive reports, printed multiple copies, and distributed them to stakeholders. This process often took weeks from data collection to delivery.
Static PDF reports, while an improvement over physical documents, maintained fundamental limitations:
- Fixed perspectives: Clients could only view data from predetermined angles and viewpoints
- Limited interactivity: No ability to toggle layers, measure distances, or explore data independently
- Version control challenges: Multiple PDF versions circulated via email, creating confusion about which report contained the latest information
- Collaboration barriers: Stakeholders needed separate communication channels to discuss findings
- Accessibility constraints: Large file sizes made mobile viewing impractical
For clients seeking answers to specific questions about their properties, these limitations meant waiting for surveyors to generate custom reports or schedule follow-up site visits. Understanding which building survey you need became complicated when clients couldn't explore initial findings interactively.
The Cloud-Based Revolution
Cloud-based survey platforms have fundamentally restructured this workflow. Modern surveying now follows a streamlined path: field teams capture data using advanced equipment (laser scanners, drones, total stations), upload information directly to cloud platforms from the field, and stakeholders access interactive dashboards immediately—often within hours rather than weeks.
This transformation addresses the core question of from static PDFs to interactive dashboards: how cloud-based survey platforms are changing client expectations by providing:
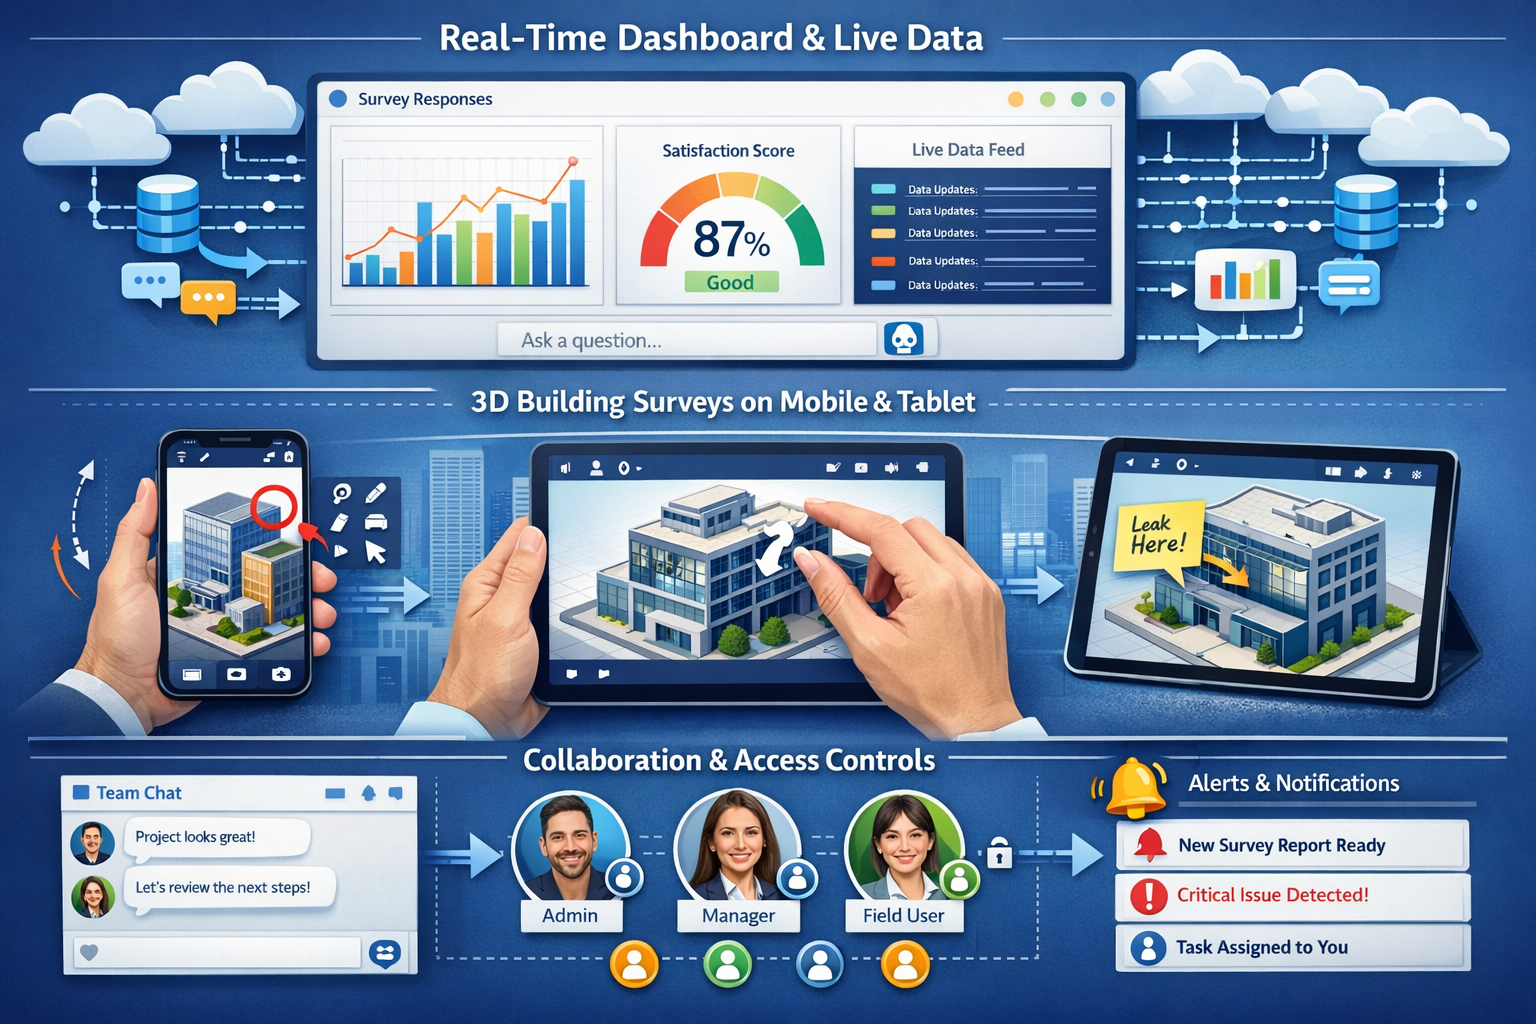
📊 Real-time data availability: Platforms update automatically as data flows in, providing near real-time visibility into project status and findings across the entire business[1]
🔄 Continuous accessibility: Stakeholders access current information 24/7 from any location with internet connectivity
💬 Integrated collaboration: Built-in chat and annotation features on dashboards allow teams to discuss insights within the platform rather than sharing static exports[1]
📱 Mobile-first design: Full-featured native apps enable comprehensive data access on smartphones and tablets[1]
The shift parallels innovations in other surveying services, such as premium drone surveys that capture aerial data and make it immediately available through cloud platforms rather than requiring extensive post-processing before delivery.
Key Features Driving the Transformation from Static PDFs to Interactive Dashboards
Natural Language Querying and AI-Powered Insights
One of the most significant barriers to effective use of survey data has been the technical expertise required to extract specific information. Traditional PDF reports forced clients to either find answers within hundreds of pages or request custom analysis from surveyors.
AI-powered natural language processing has eliminated this barrier. Platforms like Yellowfin and Zoho Analytics now include AI assistants (Yellowfin's standard feature and Zoho's "Zia") that allow users to ask questions in plain English without requiring technical expertise[2]. Clients can simply type queries like:
- "Show me all structural defects identified in the north wing"
- "What's the total area of dampness detected across all floors?"
- "Compare thermal imaging results from this survey to last year's inspection"
The platform interprets these questions, queries the underlying data, and generates appropriate visualizations—all without requiring users to understand database structures or query languages. This capability represents a fundamental shift in how cloud-based survey platforms are changing client expectations by democratizing access to insights.
Extensive Visualization Options Beyond Standard Charts
Static PDF reports typically included limited visualization types: floor plans, elevation drawings, photographs, and basic charts. Modern cloud platforms offer over 50 chart types that bring data to life with interactive visuals[2], including:
| Visualization Type | Application in Surveying | Interactive Capabilities |
|---|---|---|
| 3D Point Cloud Viewers | Display laser scan data with millions of measurement points | Rotate, zoom, measure distances, toggle color schemes |
| Heat Maps | Show moisture levels, thermal patterns, structural stress | Adjust temperature ranges, overlay on floor plans |
| Timeline Animations | Illustrate settlement progression or construction phases | Play/pause, scrub through time periods |
| Comparative Overlays | Compare as-built vs. design specifications | Toggle between views, highlight deviations |
| Interactive Floor Plans | Navigate multi-story buildings with clickable hotspots | Click to view detailed findings, photos, measurements |
These visualization options transform how clients understand complex survey findings. Rather than interpreting 2D representations, stakeholders can explore actual spatial data, gaining intuitive understanding of conditions and issues.
When clients are asking questions during a building survey, interactive dashboards allow them to explore answers visually rather than relying solely on written descriptions.
Drag-and-Drop Interfaces for Self-Service Analytics
Platforms across the board now provide drag-and-drop functionality, allowing non-technical users to create complex dashboards independently rather than relying on IT staff or analysts to generate static reports[1]. This self-service capability fundamentally changes the client-surveyor relationship.
Clients can:
✨ Customize views: Arrange data widgets to prioritize information most relevant to their needs
✨ Create custom reports: Combine different data elements without requesting new PDF reports
✨ Filter dynamically: Apply filters to focus on specific building areas, defect types, or time periods
✨ Export selectively: Generate PDF snapshots of specific views when static documentation is required
This flexibility addresses a common frustration with traditional reporting: the one-size-fits-all approach that forced all stakeholders to receive identical information regardless of their specific interests or responsibilities.
Real-Time Collaboration and Communication Tools
The shift from static PDFs to interactive dashboards: how cloud-based survey platforms are changing client expectations is perhaps most evident in collaboration capabilities. Modern platforms embed communication directly within the data environment.
Built-in collaboration features include:
💭 Contextual commenting: Stakeholders can attach comments directly to specific data points, measurements, or findings
🏷️ Tagging and mentions: Team members receive notifications when mentioned in discussions about specific issues
📝 Annotation tools: Users can mark up 3D models, floor plans, and photographs with notes and highlights
📊 Shared workspaces: Multiple users can view and interact with the same dashboard simultaneously
🔔 Activity streams: Track who has viewed data, made comments, or updated information
These features eliminate the disjointed communication that plagued traditional workflows, where survey findings existed in PDF files while discussions happened across email threads, phone calls, and separate project management platforms. For complex projects like measured building surveys, this integrated communication ensures all stakeholders maintain shared understanding.
Automated Alerts and Threshold Monitoring
Static PDF reports required manual review to identify concerning trends or conditions. Modern cloud platforms enable automated alerting, allowing users to set threshold alerts on metrics and receive notifications when specific conditions are met[1].
In surveying applications, this means:
🚨 Defect severity alerts: Automatic notifications when critical structural issues are identified
📉 Settlement monitoring: Alerts when movement exceeds acceptable thresholds
🌡️ Environmental condition warnings: Notifications about moisture levels, temperature variations, or air quality concerns
⏰ Compliance reminders: Automated alerts for required inspections or follow-up assessments
This proactive approach transforms survey data from historical documentation into an active monitoring system, enabling preventive action rather than reactive responses.
How Cloud-Based Platforms Are Reshaping Client Expectations
Expectation #1: Instant Access Across All Devices
The smartphone revolution has conditioned clients to expect information on-demand, regardless of location or device. Full-featured native apps for mobile access[1] have made this expectation standard in surveying.
Modern clients expect to:
📱 Review survey findings during site visits using tablets
💼 Access dashboards during client meetings from smartphones
🏠 Explore 3D models from home computers in the evening
✈️ Check project status while traveling using any internet-connected device
This mobility fundamentally changes how survey information integrates into decision-making processes. Rather than scheduling dedicated review sessions around PDF distribution, stakeholders incorporate survey data into their workflow naturally and continuously.
For property buyers working with chartered surveyors in locations like Berkshire or Central London, mobile access means reviewing survey findings immediately after inspections, even before leaving the property.
Expectation #2: Seamless Integration with Existing Systems
Modern businesses operate across multiple platforms: project management software, BIM (Building Information Modeling) systems, financial tools, and communication platforms. Clients now expect survey data to integrate seamlessly rather than exist in isolation.
Extensive data connectivity addresses this expectation. Looker Studio connects to over 800 data sources, while Domo offers 1,000+ pre-built integrations[2][1]. In surveying contexts, this means:
🔗 BIM integration: Survey data flows directly into Revit, AutoCAD, and other design platforms
📊 Project management connectivity: Findings automatically populate task lists in platforms like Asana or Monday.com
💰 Financial system links: Cost implications of survey findings integrate with budgeting tools
📧 CRM integration: Survey reports connect to client relationship management systems
This connectivity eliminates manual data transfer, reducing errors and ensuring all systems reflect current information. When understanding the difference between Level 2 and Level 3 surveys, clients can see how different survey depths integrate with their broader project ecosystems.
Expectation #3: Role-Based Customization and Access Control
Different stakeholders need different information. Property owners focus on maintenance priorities, contractors need technical specifications, financial advisors want cost implications, and project managers require scheduling information.
Role-based permissions and dashboards[1][8] enable granular control over who sees what information, addressing this diverse need while maintaining security. Modern platforms allow administrators to:
👤 Create user roles: Define permissions for owners, contractors, consultants, and other stakeholders
🎯 Customize dashboard views: Present relevant information to each role automatically
🔒 Control data access: Restrict sensitive information to appropriate parties
📊 Track engagement: Monitor which stakeholders have reviewed which information
This capability replaces the binary choice of traditional reporting: either distribute the entire PDF to everyone or create multiple custom reports for different audiences. The efficiency gains are substantial, particularly on large projects with numerous stakeholders.
Expectation #4: Transparent, Traceable Decision-Making
Accountability and transparency have become paramount in construction and property management. Clients expect clear documentation of when information became available, who reviewed it, and what decisions resulted.
Cloud-based platforms provide comprehensive audit trails that static PDFs cannot match:
📅 Timestamp tracking: Exact records of when data was uploaded, viewed, and modified
👥 User activity logs: Documentation of who accessed which information and when
💬 Comment histories: Complete records of discussions and decision-making processes
📄 Version control: Automatic tracking of changes with ability to revert to previous states
This transparency proves invaluable when questions arise about project decisions, particularly in scenarios involving negotiating house prices down after surveys where documented evidence of defects and their discovery timing matters significantly.
Practical Applications: From Static PDFs to Interactive Dashboards in Real Surveying Scenarios
Residential Property Purchases
The traditional residential survey process involved buyers receiving a lengthy PDF report days after the inspection, reading through technical descriptions, and scheduling follow-up calls with surveyors to clarify findings.
Interactive dashboard approach:
🏠 Buyers receive access credentials immediately after the inspection
📸 View photographs tagged to specific locations on interactive floor plans
📊 Explore defect severity ratings through visual heat maps
💰 See cost estimates for repairs with adjustable priority filters
📱 Share specific findings with contractors for immediate quotes
💬 Ask questions through integrated chat, with surveyors responding directly on relevant data points
This transformation addresses common challenges buyers face when understanding which survey they need by allowing them to explore findings at their own pace and depth.
Commercial Building Condition Assessments
Commercial property managers traditionally received quarterly or annual condition reports as static PDFs, making it difficult to track changes over time or prioritize maintenance across large portfolios.
Cloud-based platform benefits:
🏢 Portfolio dashboards: View condition metrics across all properties simultaneously
📈 Trend analysis: Automatically generated charts showing deterioration patterns
⚠️ Priority matrices: Visual representations of urgency vs. cost for all identified issues
🔄 Comparative analysis: Side-by-side comparisons of similar properties or time periods
📋 Maintenance planning: Drag-and-drop interfaces to schedule and budget repairs
For organizations managing multiple properties across regions like Buckinghamshire or Essex, this centralized visibility transforms strategic planning.
Construction Progress Monitoring
Construction projects traditionally relied on periodic progress reports with photographs and written descriptions, making it difficult to verify work completion or identify deviations from plans.
Interactive monitoring capabilities:
📐 As-built vs. design overlays: Visual comparisons highlighting deviations in real-time
📊 Completion percentages: Automatically calculated based on measured progress
🎥 Time-lapse visualizations: Animated progression through construction phases
✅ Milestone tracking: Interactive timelines showing completed, current, and upcoming work
🔍 Quality control dashboards: Defect identification with location-specific documentation
This approach proves particularly valuable for complex projects requiring measured surveys where precision and documentation are critical.
Insurance and Legal Documentation
Insurance claims and legal disputes traditionally required extensive documentation compilation from multiple PDF reports, photographs, and correspondence—a time-consuming and error-prone process.
Streamlined documentation through cloud platforms:
📑 Comprehensive evidence packages: Single-source access to all relevant data
⏱️ Timestamped records: Irrefutable documentation of condition at specific dates
🔗 Shareable access links: Provide third parties (adjusters, attorneys, experts) with controlled access
📊 Custom report generation: Create focused exports addressing specific questions
🔒 Secure archiving: Long-term storage with guaranteed accessibility
When clients need to understand why property owners hire surveyors, the ability to maintain comprehensive, accessible records represents significant value beyond the initial inspection.
Overcoming Implementation Challenges
Addressing Security and Privacy Concerns
Cloud-based platforms initially faced skepticism regarding data security, particularly for sensitive property information. Modern platforms have addressed these concerns through:
🔐 Enterprise-grade encryption: Data encrypted both in transit and at rest
🌍 Geographic data residency: Options to store data in specific jurisdictions for compliance
👤 Multi-factor authentication: Enhanced access security beyond simple passwords
🔍 Penetration testing: Regular security audits and vulnerability assessments
📜 Compliance certifications: SOC 2, ISO 27001, and industry-specific standards
These measures now often exceed the security of traditional email-based PDF distribution, where files could be forwarded, downloaded to unsecured devices, or accessed by unauthorized parties.
Managing the Transition Period
Organizations shifting from static PDFs to interactive dashboards face practical challenges during implementation:
Common transition obstacles:
- Staff accustomed to traditional workflows resist new processes
- Clients unfamiliar with interactive platforms request familiar PDF formats
- Legacy data exists only in static formats
- Investment required in training and platform subscriptions
Successful transition strategies:
✅ Hybrid approach: Offer both interactive dashboards and PDF exports during transition
📚 Comprehensive training: Provide tutorials, webinars, and support for clients and staff
🔄 Gradual rollout: Start with enthusiastic early adopters before full implementation
📊 Demonstrate ROI: Track and communicate time savings and efficiency gains
🎯 Customize onboarding: Tailor training to different user roles and technical comfort levels
Organizations serving diverse client bases across locations like North West London or Chelsea may find different adoption rates among client segments, requiring flexible implementation approaches.
Ensuring Data Quality and Standardization
Interactive dashboards amplify both good and bad data quality. While static PDFs could hide inconsistencies through narrative descriptions, dynamic visualizations immediately expose data quality issues.
Quality assurance requirements:
🎯 Standardized data collection: Consistent field procedures and nomenclature
✅ Validation rules: Automated checks for completeness and accuracy
📋 Quality control workflows: Review processes before data publication
🔄 Continuous improvement: Feedback loops to refine collection methods
📊 Performance metrics: Track data quality indicators over time
High-quality data collection becomes even more critical when clients can independently explore and analyze information, as inconsistencies or errors become immediately apparent.
The Future: What's Next for Cloud-Based Survey Platforms
Artificial Intelligence and Predictive Analytics
Current platforms primarily present collected data interactively. The next evolution incorporates AI-driven predictive capabilities:
🤖 Automated defect detection: AI algorithms identify issues in photographs and point cloud data
📈 Predictive maintenance: Machine learning models forecast when building components will require attention
🔍 Pattern recognition: Identify recurring issues across property portfolios
💡 Intelligent recommendations: Suggest optimal remediation strategies based on historical data
⚡ Anomaly detection: Automatically flag unusual conditions requiring attention
These capabilities will transform surveys from documentation tools to predictive planning resources, enabling proactive rather than reactive property management.
Augmented Reality Integration
The convergence of cloud-based survey data with augmented reality (AR) technology promises revolutionary visualization capabilities:
👓 On-site AR overlays: View survey findings overlaid on actual building elements through AR glasses or tablets
🔧 Maintenance guidance: Step-by-step AR instructions for repairs based on survey findings
📐 Design visualization: See proposed modifications in context before implementation
🎓 Training applications: Interactive AR tutorials for understanding building systems
🏗️ Construction verification: Real-time comparison of built work against design intent
This integration will further blur the line between digital documentation and physical reality, making survey data more immediately actionable.
Blockchain for Data Integrity
Blockchain technology offers potential solutions for long-term data integrity and verification:
🔗 Immutable records: Tamper-proof documentation of survey findings and timestamps
✅ Verification chains: Traceable history of data collection, processing, and modifications
🤝 Smart contracts: Automated actions triggered by survey findings (e.g., insurance claims)
🌐 Distributed storage: Redundant data preservation across multiple nodes
📜 Regulatory compliance: Built-in audit trails meeting legal requirements
While still emerging, blockchain integration could address concerns about data authenticity and long-term preservation that static PDFs inadequately solve.
Expanded White-Label and Embedded Analytics
White-label and embedded analytics capabilities allow businesses to integrate dashboards within their own applications[2], a trend that will accelerate as clients expect seamless experiences:
🏢 Client portals: Property owners access survey data through their existing management platforms
🔌 API-first architecture: Easy integration with any third-party system
🎨 Complete customization: Dashboards match client branding and design preferences
📱 Native app embedding: Survey data within property management mobile apps
🔄 Bidirectional data flow: Updates in either system automatically sync
This evolution will make survey data feel like a native component of clients' existing workflows rather than a separate platform requiring context switching.
Measuring Success: KPIs for Interactive Dashboard Adoption
Organizations implementing cloud-based survey platforms should track specific metrics to evaluate success:
Efficiency Metrics
⏱️ Time to delivery: Hours from data collection to client access (target: <24 hours vs. weeks for PDFs)
📊 Report generation time: Minutes to create custom views vs. hours for custom PDF reports
🔄 Revision cycles: Number of follow-up requests for clarification or additional information
💰 Cost per deliverable: Total platform and labor costs divided by number of surveys delivered
Engagement Metrics
👥 User adoption rate: Percentage of clients actively using interactive dashboards vs. requesting PDFs
📈 Session frequency: How often stakeholders access dashboards (daily, weekly, monthly)
⏲️ Time spent: Average duration of dashboard sessions indicating engagement depth
💬 Collaboration activity: Number of comments, annotations, and discussions within platform
Client Satisfaction Metrics
⭐ Net Promoter Score: Likelihood clients would recommend services to others
😊 Satisfaction ratings: Direct feedback on dashboard usability and value
🔄 Retention rates: Client renewal and repeat business percentages
📣 Referral volume: New clients acquired through existing client recommendations
Business Impact Metrics
💵 Revenue per client: Increased value from additional services enabled by platform capabilities
📊 Market differentiation: Win rate when competing against firms using traditional delivery methods
🎯 Service expansion: New service offerings enabled by interactive capabilities
🚀 Competitive positioning: Market share growth in target segments
Tracking these metrics demonstrates the tangible value of transitioning from static PDFs to interactive dashboards beyond anecdotal benefits.
Conclusion: Embracing the Interactive Future
The transformation from static PDFs to interactive dashboards: how cloud-based survey platforms are changing client expectations represents far more than a technological upgrade. It fundamentally reshapes the relationship between surveyors and clients, transforming passive information recipients into active data explorers.
The evidence is compelling: platforms now offer real-time dashboard automation[1], natural language querying that eliminates technical barriers[2], mobile accessibility through full-featured apps[1], connections to hundreds of data sources[2][1], drag-and-drop interfaces enabling self-service analytics[1], over 50 visualization types[2], automated alerting systems[1], and sophisticated role-based access controls[1][8].
These capabilities address longstanding frustrations with traditional reporting: delays, limited perspectives, collaboration barriers, and accessibility constraints. More importantly, they enable entirely new approaches to property management, construction oversight, and investment decision-making.
The competitive landscape is clear: organizations that embrace interactive, cloud-based delivery methods will increasingly differentiate themselves from those clinging to traditional PDF-based workflows. Clients who experience the transparency, accessibility, and collaborative power of modern platforms will find it difficult to accept less from future service providers.
Actionable Next Steps
For surveying professionals ready to embrace this transformation:
-
Evaluate platform options: Research cloud-based survey platforms suited to your practice areas and client base, considering factors like ease of use, integration capabilities, and pricing models
-
Start with pilot projects: Select enthusiastic clients for initial implementations, gathering feedback and refining processes before broader rollout
-
Invest in training: Ensure both staff and clients receive comprehensive onboarding to maximize platform value and adoption
-
Develop hybrid workflows: Maintain PDF export capabilities during transition while encouraging interactive dashboard use as the primary delivery method
-
Measure and communicate value: Track efficiency gains, client satisfaction improvements, and business impact to justify continued investment and expansion
-
Stay informed: Monitor emerging technologies like AI, AR, and blockchain that will further transform survey delivery in coming years
-
Gather client feedback: Regularly solicit input on dashboard usability and desired features to guide platform selection and customization
For clients and property stakeholders:
-
Request interactive deliverables: When engaging surveyors, inquire about cloud-based dashboard options rather than accepting static PDFs as default
-
Explore platform capabilities: Take time to learn interactive features rather than simply downloading PDF exports, maximizing the value of modern delivery methods
-
Provide feedback: Share your experience with surveyors to help them refine their digital offerings
-
Integrate with existing systems: Explore how survey data can connect to your project management, BIM, or property management platforms
The future of surveying is interactive, collaborative, and cloud-based. Organizations and clients who embrace this reality position themselves for success in an increasingly digital built environment. The question is no longer whether to make this transition, but how quickly to implement it before competitors and client expectations make traditional methods obsolete.
Whether you're seeking building surveys in locations across the UK or managing large commercial portfolios, the shift from static documentation to dynamic, interactive platforms represents an opportunity to fundamentally improve how survey data creates value. The technology exists, the benefits are proven, and client expectations are evolving rapidly. The time to act is now.
References
[1] The Best Data Visualization Tools Top Bi Software – https://improvado.io/blog/the-best-data-visualization-tools-top-bi-software
[2] 15 Best Data Visualization Tools In 2026 – https://blog.iq.dwellsy.com/15-best-data-visualization-tools-in-2026/
[8] Enterprise Survey Software – https://www.pollfish.com/resources/blog/market-research/enterprise-survey-software/