The property surveying industry stands at a technological crossroads in 2026. While traditional methods served professionals well for decades, the sheer volume of data now available—from zoning regulations and utility networks to environmental constraints and demographic trends—demands a more sophisticated approach. GIS Integration for Smarter Property Surveys: Overlaying Data for Better Decision-Making represents the evolution from isolated data points to comprehensive spatial intelligence that transforms how surveyors, developers, and planners approach land use decisions.
Imagine viewing a property not just as a physical plot of land, but as a multi-dimensional canvas where zoning boundaries, underground utilities, flood risk zones, soil composition, and infrastructure accessibility all appear simultaneously on a single interactive map. This is the power of Geographic Information Systems (GIS) integration—a technology that centralizes disparate datasets into visual, analyzable formats that reveal patterns invisible to conventional survey methods.
Key Takeaways
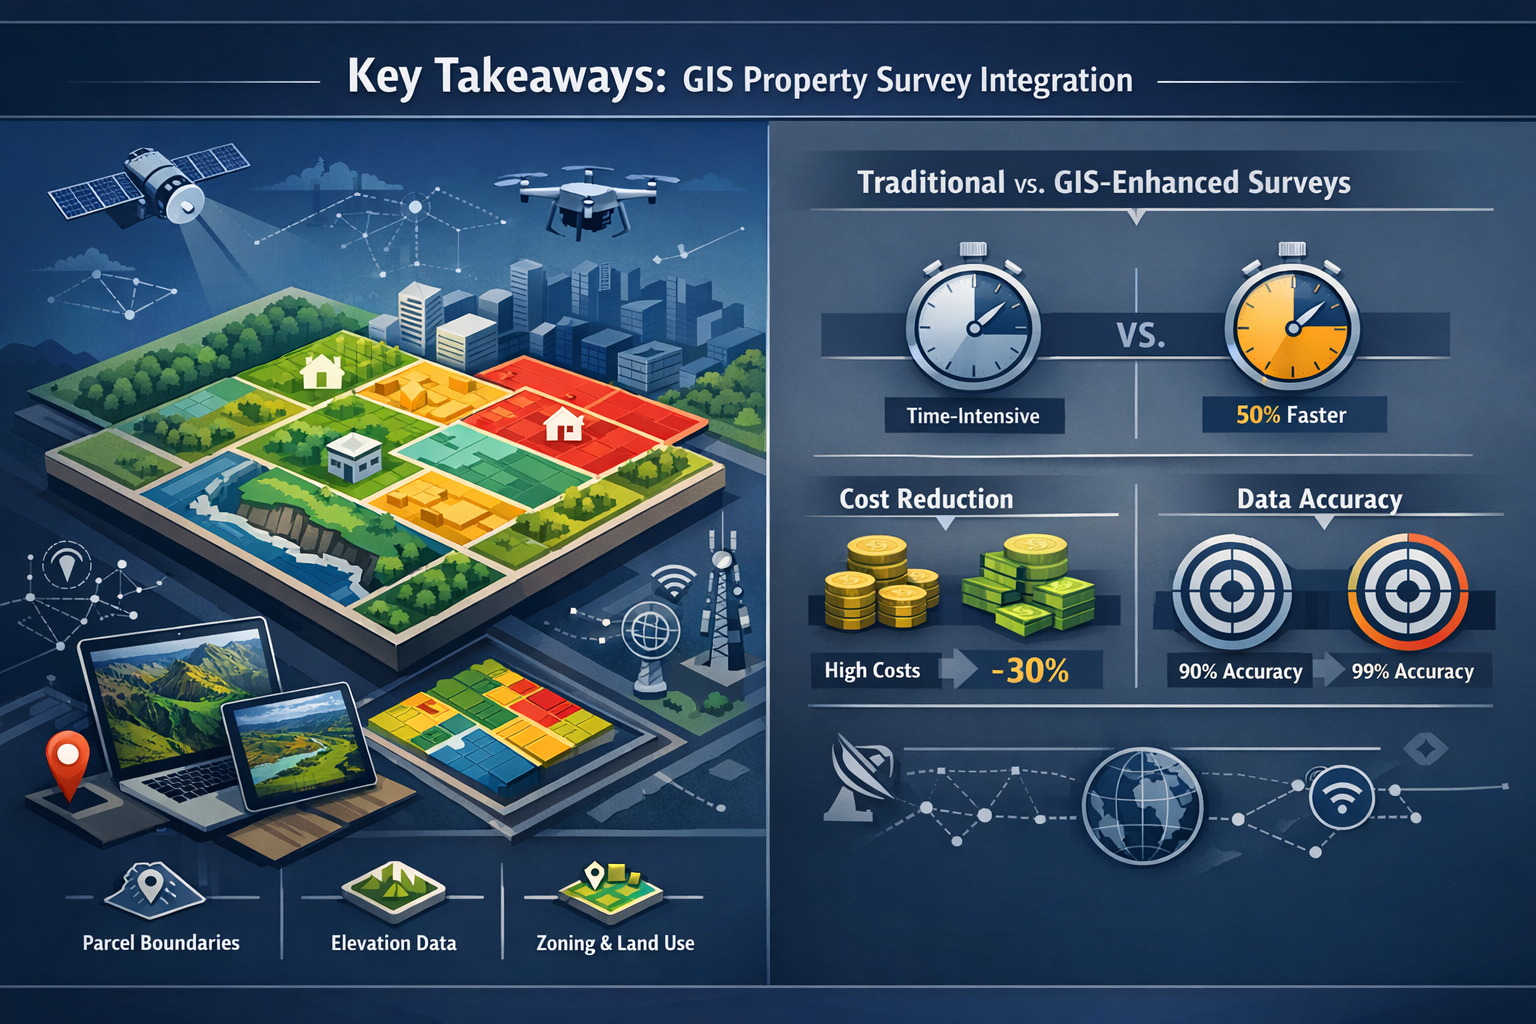
- GIS integration consolidates multiple data sources including zoning maps, property boundaries, utility locations, and environmental data into a single interactive platform, reducing project timelines by 40-50%[4]
- Visual data overlays enable better decision-making by revealing spatial relationships between infrastructure, land use patterns, and regulatory constraints that traditional surveys cannot easily identify
- Implementation follows a structured process from data collection and software selection through layer configuration and team training, making adoption accessible for surveying firms of all sizes
- Infrastructure and agriculture sectors benefit most significantly from GIS integration through improved planning accuracy, risk mitigation, and resource optimization
- Real-time collaboration and cloud-based delivery replace static survey documents, enabling stakeholders to access updated 3D visualizations and make informed decisions faster
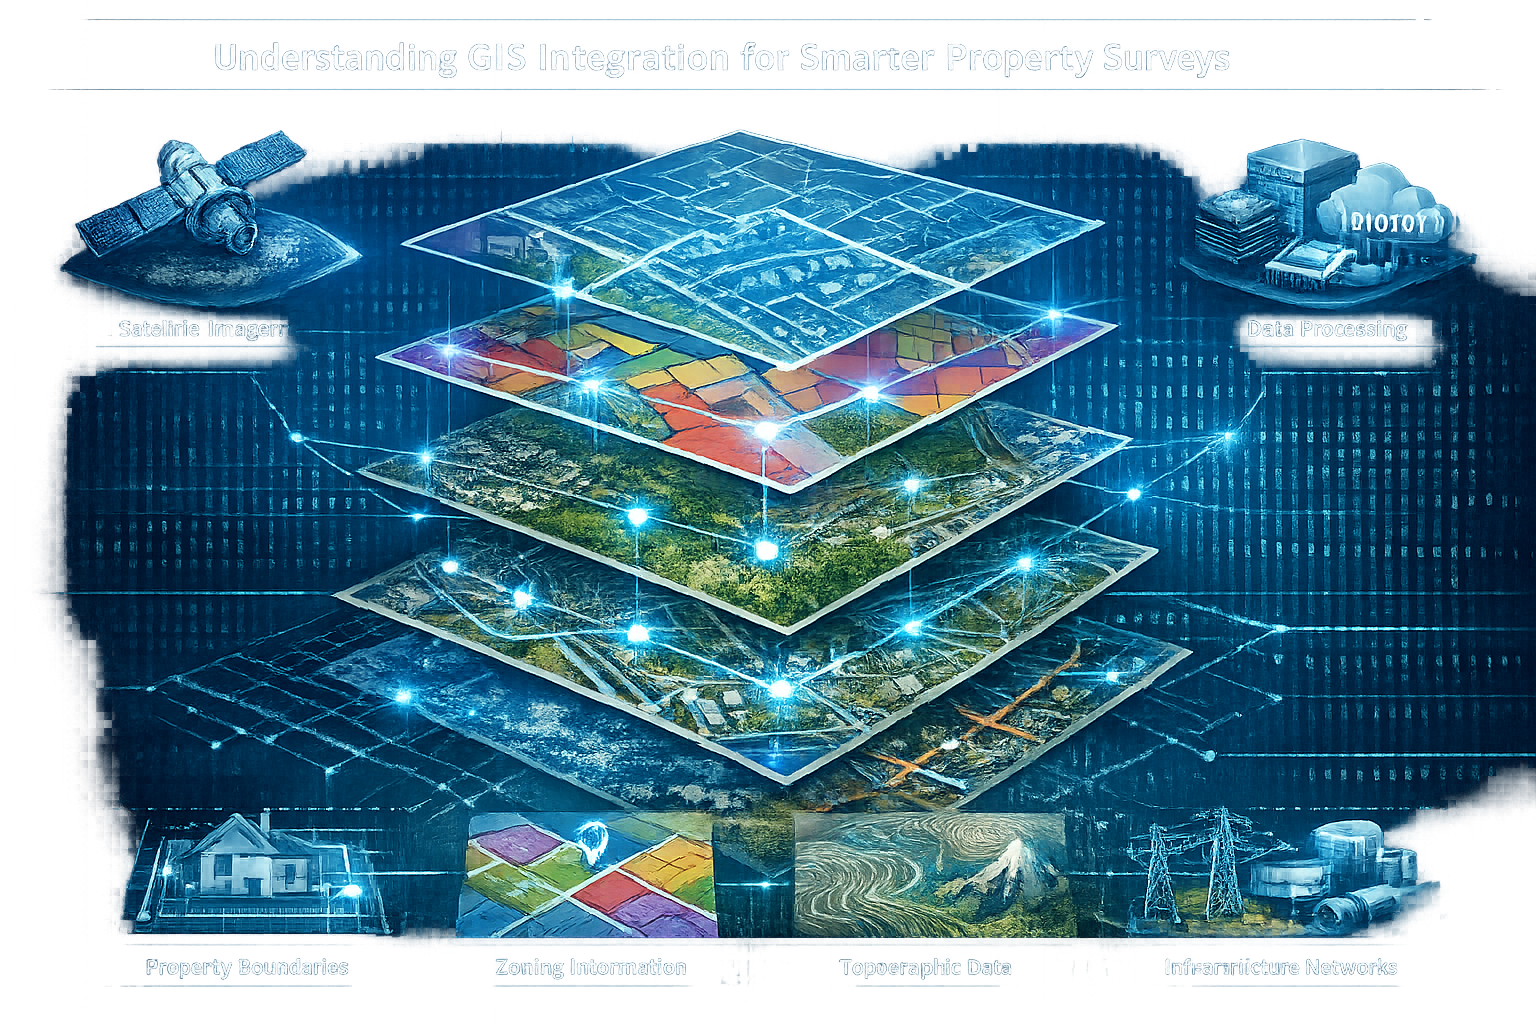
Understanding GIS Integration for Smarter Property Surveys
What Is GIS Integration in Property Surveying?
Geographic Information Systems (GIS) represent specialized software platforms designed to capture, store, analyze, and display geographically referenced information. When integrated into property surveying workflows, GIS transforms raw survey data into intelligent spatial databases that link physical measurements to contextual information about land use, regulations, and environmental factors.
Traditional property surveys typically deliver static documents—printed plans showing boundaries, elevations, and physical features. While accurate, these documents exist in isolation from the broader spatial context that influences property value and development potential. GIS integration changes this paradigm by enabling surveyors to overlay multiple datasets within a single interactive environment[2].
The core components of GIS integration include:
- 📍 Spatial data layers: Individual datasets representing different information types (boundaries, utilities, zoning)
- 🗺️ Base mapping: Aerial imagery, topographic maps, or street networks providing geographic context
- 🔧 Analysis tools: Software functions that measure distances, calculate areas, and identify spatial relationships
- 💾 Database management: Systems organizing attribute data linked to geographic features
- 📱 Visualization interfaces: Interactive maps accessible across desktop and mobile devices
The Evolution from Traditional to Integrated Surveying
The surveying profession has undergone remarkable technological transformation over the past two decades. Early adoption of total stations and GPS receivers improved measurement accuracy, while CAD software streamlined drafting processes. However, these tools still treated survey data as isolated projects rather than components of a broader spatial ecosystem.
GIS integration represents the next evolutionary step by connecting survey deliverables to external data sources maintained by government agencies, utility companies, and environmental organizations. A comprehensive building survey conducted in 2026 might incorporate:
- Local authority planning constraints
- Utility company infrastructure records
- Environment Agency flood risk data
- Historical land use information
- Demographic and market analytics
This integration enables surveyors to provide clients with contextual intelligence beyond physical measurements—answering questions about development feasibility, regulatory compliance, and long-term risk exposure that traditional surveys cannot address.
Core Benefits of Data Overlay Technology
The fundamental advantage of GIS Integration for Smarter Property Surveys: Overlaying Data for Better Decision-Making lies in its ability to reveal spatial relationships that remain hidden when datasets exist separately. When surveyors overlay zoning boundaries onto property parcels, for example, they immediately identify which portions of a site fall within different regulatory zones—information critical for development planning.
Key benefits include:
| Benefit Category | Traditional Approach | GIS-Integrated Approach |
|---|---|---|
| Data Access | Manual research across multiple agencies | Centralized repository with instant access[2] |
| Analysis Time | Hours to days for spatial calculations | Minutes through automated tools |
| Visualization | Static 2D drawings | Interactive 3D models with layer control |
| Collaboration | Physical document exchange | Real-time cloud-based sharing[1] |
| Update Management | Complete redrafting required | Layer-specific revisions |
| Decision Support | Limited contextual information | Comprehensive spatial intelligence |
Modern drone survey technology captures aerial imagery and elevation data that, when integrated into GIS platforms, creates high-resolution base maps for overlay analysis. This combination of remote sensing and spatial database technology delivers unprecedented insight into property characteristics and development potential.
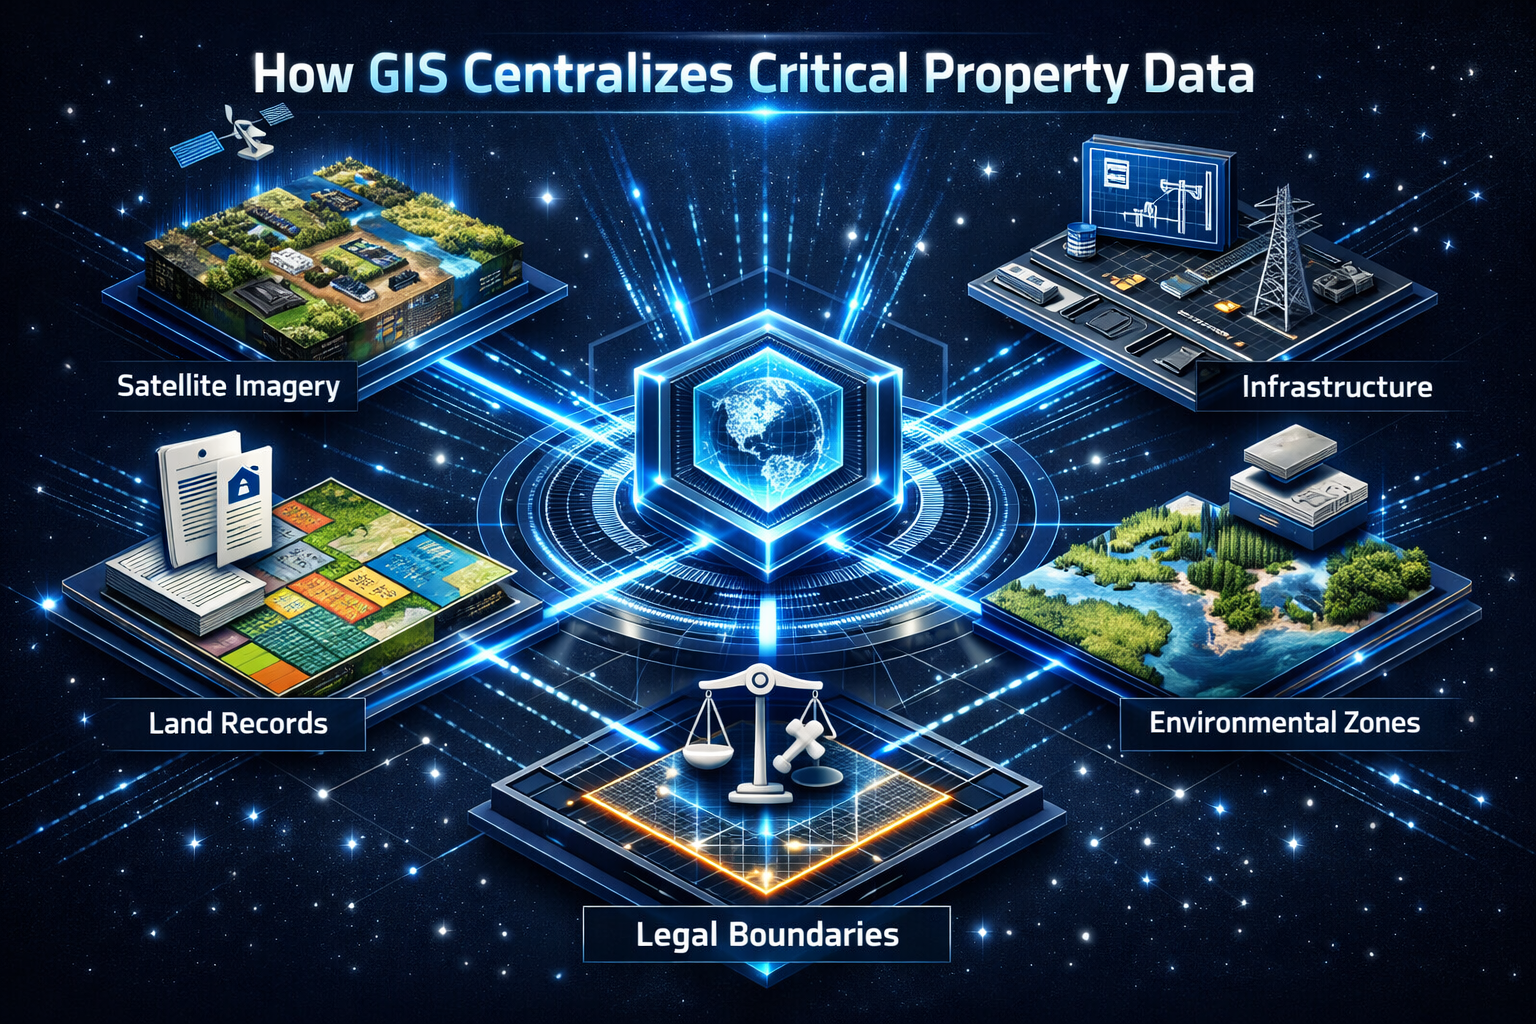
How GIS Centralizes Critical Property Data
Consolidating Zoning Information and Regulatory Boundaries
Zoning regulations represent one of the most complex yet critical datasets for property development decisions. Local authorities maintain detailed maps showing permitted land uses, building height restrictions, setback requirements, and special overlay zones for historic preservation or environmental protection. Accessing this information traditionally required visiting planning offices, reviewing paper maps, and manually transferring boundaries onto survey drawings.
GIS integration automates this process by importing digital zoning data directly into the surveying platform. Surveyors can overlay official zoning boundaries onto property parcels with precision, instantly identifying:
- Which zoning districts affect the property
- Percentage of land area within each zone
- Specific use restrictions and dimensional requirements
- Overlay zones imposing additional constraints
- Proximity to zone boundaries affecting future expansion
This capability proves particularly valuable for property development projects where understanding regulatory constraints early in the planning process prevents costly design revisions. When zoning data updates—such as when local authorities adopt new comprehensive plans—GIS systems can incorporate these changes across all affected properties in the database.
Mapping Utility Infrastructure and Service Networks
Underground utilities represent significant constraints and opportunities for property development. Water mains, sewer lines, gas pipelines, electrical conduits, and telecommunications cables occupy subsurface space that development plans must accommodate. Traditional utility research involves contacting multiple service providers, waiting for record searches, and manually plotting locations based on descriptions that may lack precision.
GIS integration transforms utility mapping by consolidating infrastructure data from multiple providers into coordinated spatial layers[2]. Modern implementations include:
🔌 Electrical infrastructure: Transmission lines, substations, service connections, and easements
💧 Water systems: Distribution mains, service laterals, valves, hydrants, and pressure zones
🚰 Wastewater networks: Gravity sewers, force mains, pump stations, and treatment facility locations
⛽ Gas distribution: High-pressure transmission lines, distribution networks, and safety buffer zones
📡 Communications: Fiber optic cables, cellular towers, and broadband infrastructure
By overlaying these utility layers onto property boundaries and proposed development plans, surveyors identify potential conflicts before construction begins. The analysis reveals optimal connection points for new service installations and highlights areas requiring careful excavation due to congested underground conditions.
Integrating Property Boundaries and Cadastral Data
Property boundaries form the legal foundation of land ownership and development rights. Cadastral data—the official record of property parcels maintained by land registry offices—provides definitive information about ownership, dimensions, easements, and encumbrances. Integrating this data into GIS platforms creates a comprehensive property intelligence system that links survey measurements to legal records.
Advanced GIS implementations incorporate:
- Deed boundary overlays: Legal descriptions converted to geographic coordinates
- Easement mapping: Rights-of-way, utility easements, and access restrictions visualized spatially
- Title exception visualization: Survey-related title issues displayed on interactive maps
- Historical boundary evolution: Time-series data showing property subdivision and consolidation
- Adjoining property information: Ownership and use data for neighboring parcels
This integration proves essential for Level 3 full building surveys where understanding boundary relationships, potential encroachments, and access rights significantly impacts property value and development potential. When combined with field survey measurements, GIS analysis can identify discrepancies between legal descriptions and physical occupation that require resolution.
Environmental and Topographic Data Layers
Environmental constraints increasingly influence property development decisions as regulatory frameworks address climate change, habitat protection, and natural resource conservation. GIS integration enables surveyors to overlay environmental data layers that reveal constraints and opportunities invisible to traditional survey methods.
Critical environmental datasets include:
🌊 Flood risk zones: FEMA flood maps, historical flooding records, and future projection models
🌳 Wetland boundaries: Jurisdictional wetlands requiring permits for disturbance
🏔️ Topographic features: Elevation contours, slope analysis, and watershed boundaries
🦅 Protected habitats: Endangered species locations and critical habitat designations
🌡️ Climate data: Temperature zones, precipitation patterns, and extreme weather exposure
Topographic analysis within GIS platforms enables automated calculation of slope percentages, drainage patterns, and viewshed analysis—determining which portions of a property have visibility to or from specific locations. This capability supports design decisions for building placement, access road routing, and landscape planning.
Environmental data overlay also supports risk assessment for property valuation and insurance purposes. By identifying flood zones, erosion-prone slopes, and wildfire risk areas, surveyors provide clients with comprehensive information for budgeting repairs and restoration over the property's lifecycle.
Benefits for Infrastructure and Agriculture Sectors
Infrastructure Planning and Development Applications
Infrastructure projects—from transportation networks to utility expansions—require coordination of vast amounts of spatial data across extensive geographic areas. GIS Integration for Smarter Property Surveys: Overlaying Data for Better Decision-Making delivers transformative benefits for infrastructure planning by enabling comprehensive corridor analysis, right-of-way optimization, and impact assessment.
Transportation infrastructure projects benefit from GIS integration through:
- Route optimization: Analyzing terrain, existing development, and environmental constraints to identify optimal alignments
- Right-of-way acquisition: Identifying affected properties and calculating acquisition costs based on parcel data
- Utility conflict analysis: Detecting existing infrastructure that requires relocation or protection
- Environmental impact assessment: Quantifying wetland impacts, habitat disturbance, and stormwater management requirements
- Construction staging: Planning equipment access, material storage, and traffic management based on spatial constraints
Utility infrastructure expansion leverages GIS overlay capabilities to identify service gaps, prioritize expansion areas based on demographic data, and optimize network design for efficiency. When planning water main extensions, for example, engineers overlay population density, existing infrastructure capacity, and topographic data to design systems that minimize pumping costs while ensuring adequate pressure throughout the service area.
The efficiency gains are substantial—industry applications demonstrate that GIS integration can reduce project timelines by 40-50%[4] through improved coordination and early identification of constraints that would otherwise cause delays during construction.
Agricultural Land Management and Precision Farming
Agricultural applications of GIS integration extend beyond traditional property surveys into operational management of farming enterprises. Modern precision agriculture relies on spatial data overlay to optimize crop production, manage resources efficiently, and demonstrate environmental stewardship.
Agricultural GIS applications include:
🌾 Soil mapping: Overlaying soil survey data with field boundaries to guide variable-rate fertilizer application
💧 Irrigation management: Combining topography, soil moisture sensors, and crop water requirements for efficient water use
🚜 Equipment guidance: GPS-enabled machinery using GIS data for precise planting, spraying, and harvesting
📊 Yield monitoring: Spatial analysis of harvest data to identify productivity patterns and management zones
🌱 Crop rotation planning: Historical field use data informing rotation decisions and nutrient management
Property surveys for agricultural land increasingly incorporate precision agriculture data layers that add value beyond boundary determination. When agricultural properties change ownership or undergo estate planning, GIS-integrated surveys provide comprehensive information about soil quality variations, drainage patterns, and production potential that influences valuation.
Environmental compliance represents another critical application. Agricultural operations face increasing regulatory scrutiny regarding nutrient management, erosion control, and habitat protection. GIS overlay analysis helps farmers demonstrate compliance by documenting buffer zones around waterways, tracking manure application rates relative to soil capacity, and identifying environmentally sensitive areas requiring special management.
Urban Planning and Smart City Development
Urban environments generate enormous volumes of spatial data—from building footprints and transportation networks to demographic patterns and economic activity. GIS integration enables urban planners to synthesize this information for evidence-based decision-making about growth management, infrastructure investment, and service delivery.
Smart city initiatives in 2026 rely heavily on GIS platforms that integrate:
- Real-time sensor data: Traffic flows, air quality, noise levels, and energy consumption
- Demographic analytics: Population distribution, age profiles, and socioeconomic characteristics
- Land use inventories: Building types, vacancy rates, and development intensity
- Service delivery metrics: Emergency response times, transit accessibility, and park distribution
- Economic indicators: Property values, business locations, and employment centers
When conducting property inspections in urban contexts, surveyors access GIS platforms containing comprehensive neighborhood data that contextualizes individual properties within broader market and regulatory frameworks. This integration supports more accurate valuation and development feasibility analysis.
Urban planners use GIS overlay analysis to evaluate proposed zoning changes, assess infrastructure capacity for new development, and model the spatial impacts of policy decisions. The technology enables scenario planning—comparing alternative future growth patterns and their implications for transportation, utilities, and environmental quality.
Step-by-Step Implementation Guide for GIS Integration
Phase 1: Data Collection and Source Identification
Successful GIS integration begins with systematic identification and acquisition of relevant spatial datasets. The implementation process starts by defining project objectives and determining which data layers will support decision-making for the specific surveying application.
Essential data sources include:
- Government agencies: Local planning departments, land registry offices, environmental agencies, and transportation authorities maintain authoritative datasets often available through open data portals
- Utility providers: Water, sewer, electric, gas, and telecommunications companies hold infrastructure location data, though access policies vary
- Field survey data: GPS measurements, drone surveys, and terrestrial laser scanning provide site-specific information
- Commercial data vendors: Specialized companies offer curated datasets for demographics, market analytics, and environmental risk
- Historical archives: Legacy maps and aerial photographs provide temporal context for land use changes
Data quality assessment represents a critical step in this phase. Not all spatial data meets surveying accuracy standards—some datasets may contain positional errors of several meters, while survey-grade measurements achieve centimeter-level precision. Understanding accuracy limitations prevents inappropriate use of data for applications requiring higher precision than the source provides.
Modern GNSS (Global Navigation Satellite System) technology now achieves centimeter-level accuracy for real-time data collection[1], providing high-quality base data for GIS integration. When combined with aerial imagery from drone platforms, surveyors create comprehensive spatial databases that support detailed analysis.
Phase 2: Software Selection and Platform Configuration
Choosing appropriate GIS software depends on project scale, technical requirements, budget constraints, and integration needs with existing surveying tools. The 2026 market offers options ranging from enterprise-level platforms to specialized surveying applications with GIS capabilities.
Software evaluation criteria:
| Criterion | Considerations |
|---|---|
| Functionality | Required analysis tools, 3D visualization, database management capabilities |
| Compatibility | Integration with CAD software, survey equipment, and data exchange formats |
| Scalability | Capacity to handle project size and data volumes |
| User interface | Learning curve for staff and client accessibility |
| Cloud capabilities | Remote access, collaboration tools, and mobile field applications |
| Cost structure | Licensing models, maintenance fees, and training expenses |
Popular platforms for surveying applications include industry-standard GIS software with robust spatial analysis capabilities, specialized surveying packages with integrated GIS functionality[7], and cloud-based solutions emphasizing collaboration and accessibility.
Configuration involves establishing data standards for layer naming, coordinate systems, attribute schemas, and symbology. Consistent standards ensure that projects remain organized and accessible as data volumes grow. Coordinate system selection proves particularly important—choosing systems appropriate for the project area prevents distortion and ensures compatibility with external datasets.
Phase 3: Layer Configuration and Data Overlay Setup
With software selected and data acquired, the implementation process moves to organizing information into logical layers and establishing overlay relationships. Effective layer configuration follows hierarchical principles that group related information and control display order for optimal visualization.
Recommended layer organization structure:
📋 Base layers (bottom):
- Aerial imagery or topographic maps
- Property parcel boundaries
- Street networks and address points
📋 Infrastructure layers (middle):
- Utility networks (separate layers by type)
- Transportation facilities
- Public facilities and services
📋 Regulatory layers (middle-upper):
- Zoning districts and overlay zones
- Environmental constraints
- Easements and rights-of-way
📋 Analysis layers (top):
- Survey measurements and observations
- Proposed development plans
- Analytical results and annotations
Layer styling—colors, line weights, transparency, and labeling—significantly impacts usability. Effective styling uses intuitive color schemes (blue for water, green for parks, red for constraints) and adjusts transparency to allow multiple layers to display simultaneously without obscuring underlying information.
Advanced configuration includes establishing spatial relationships between layers through topology rules. These rules maintain data integrity by preventing invalid geometries, enforcing boundary alignment between adjacent parcels, and ensuring that point features fall within appropriate polygon boundaries.
Phase 4: Team Training and Workflow Integration
Technology adoption succeeds only when team members understand capabilities and incorporate tools into daily workflows. Training programs should address both technical software operation and conceptual understanding of spatial analysis principles.
Training curriculum components:
- GIS fundamentals: Coordinate systems, spatial data types, and database concepts
- Software operation: Navigation, layer management, and basic analysis tools
- Data quality: Accuracy assessment, error identification, and validation procedures
- Analysis techniques: Overlay operations, buffer analysis, and proximity calculations
- Visualization: Map composition, symbology design, and 3D model creation
- Collaboration: Cloud platform use, version control, and stakeholder communication
Workflow integration requires identifying specific points in existing surveying processes where GIS analysis adds value. For building surveys, this might include pre-survey research using GIS to identify constraints, field data collection with GPS-enabled devices that feed directly into GIS databases, and final deliverable preparation combining traditional survey drawings with interactive GIS visualizations.
Establishing quality control procedures ensures consistent output quality. These procedures might include peer review of GIS analysis, automated validation checks for data completeness, and standardized templates for client deliverables.
Phase 5: Deployment and Continuous Improvement
Initial deployment typically begins with pilot projects that test workflows and identify refinement opportunities before full-scale implementation. Pilot projects should represent typical work while being manageable in scope, allowing teams to develop proficiency without overwhelming time pressure.
Deployment best practices:
✅ Start with internal projects to develop skills before client-facing applications
✅ Document workflows and create reference materials for common tasks
✅ Establish feedback mechanisms for identifying improvement opportunities
✅ Monitor time expenditure to quantify efficiency gains
✅ Develop client education materials explaining GIS deliverable benefits
✅ Create data backup and disaster recovery procedures
Continuous improvement involves regularly evaluating new data sources, software capabilities, and analysis techniques that enhance service delivery. The rapid pace of technological advancement means that GIS capabilities expand continuously—AI-assisted workflows now automatically classify terrain, identify markers, and flag anomalies[1], reducing manual processing time.
Building relationships with data providers ensures access to updated information. Many government agencies release data updates on regular schedules, while utility companies may provide access to infrastructure records through formal agreements. Maintaining current data prevents analysis based on outdated information that could lead to flawed conclusions.
Advanced Applications and Emerging Technologies
AI-Powered Analysis and Automated Quality Control
Artificial intelligence integration represents the cutting edge of GIS Integration for Smarter Property Surveys: Overlaying Data for Better Decision-Making in 2026. AI systems now perform tasks that previously required extensive manual effort, from terrain classification to anomaly detection and preliminary surface modeling[1].
AI applications in GIS-integrated surveying include:
- Automated feature extraction: AI algorithms analyze aerial imagery to identify buildings, roads, vegetation, and other features, automatically creating GIS layers
- Quality assurance: AI systems compare survey measurements against expected patterns, flagging inconsistencies before projects reach drafting stages[1]
- Predictive analytics: Machine learning models analyze historical data to predict risks including flooding and landslides[2], though these capabilities remain in early development
- Change detection: AI compares temporal datasets to identify landscape changes, unauthorized construction, or environmental impacts
- Natural language processing: AI interprets legal descriptions and planning documents, extracting spatial information for GIS integration
The efficiency gains from AI integration compound the benefits of basic GIS adoption. While GIS overlay already reduces project timelines by 40-50%[4], AI automation further accelerates analysis and improves accuracy through consistent application of classification rules and detection algorithms.
Real-Time 3D Digital Twins and Visualization
Digital twin technology—high-fidelity 3D models that update continuously as new data becomes available—represents a paradigm shift in surveying deliverables. Rather than static documents frozen at a point in time, digital twins provide living representations of properties and infrastructure that evolve with changing conditions[1].
Modern digital twins integrate:
🏗️ Physical geometry: Precise 3D models from laser scanning and photogrammetry
📊 Sensor data: Real-time monitoring of structural movement, temperature, moisture, and other parameters
📅 Temporal data: Historical changes and future projections
🔄 Simulation capabilities: Modeling scenarios like slope erosion, water flow, vegetation growth, and infrastructure stress
For infrastructure projects, digital twins enable stakeholders to visualize proposed designs in context, simulate operational scenarios, and plan maintenance activities. Agricultural applications use digital twins to model crop growth under different management scenarios, optimizing resource allocation.
Cloud-based delivery of digital twins enables instant access for all project stakeholders through web browsers and mobile devices, eliminating the need for specialized software. This accessibility democratizes spatial data, allowing clients to explore properties and make informed decisions without technical expertise.
Multi-Sensor Drone Systems and Remote Sensing Integration
Unmanned aerial vehicle (UAV) technology has evolved from simple photography platforms to sophisticated multi-sensor systems that capture diverse data types simultaneously. Modern drone systems integrate synchronized sensor arrays including LiDAR, photogrammetry cameras, multispectral sensors, and thermal imaging[1], creating comprehensive datasets for GIS integration.
Multi-sensor capabilities enable:
- LiDAR: Penetrates vegetation to map ground surface and create detailed elevation models
- RGB photography: Provides high-resolution visual documentation and orthophoto base maps
- Multispectral imaging: Captures wavelengths beyond visible light for vegetation health analysis and material identification
- Thermal imaging: Detects temperature variations indicating moisture intrusion, insulation defects, or equipment malfunction
When integrated into GIS platforms, multi-sensor drone data creates rich information layers supporting diverse analysis applications. Agricultural surveys use multispectral data to assess crop health and identify irrigation issues. Infrastructure inspections combine thermal and visual data to detect maintenance needs. Environmental assessments use LiDAR to map wetland boundaries and model flood risk.
The combination of drone data collection and GIS analysis delivers results impossible with traditional methods. Surveyors can map large properties in hours rather than days, capturing comprehensive information about conditions throughout the site rather than at discrete measurement points.
Cloud-Based Collaboration and Mobile Field Applications
Cloud computing fundamentally changes how surveying teams collect, process, and deliver spatial information. Rather than isolated desktop workstations, cloud-based GIS platforms enable real-time collaboration among field crews, office staff, and clients regardless of location[1].
Cloud platform capabilities include:
- Instant file sharing: Automatic synchronization of field data to central databases
- 3D browser visualization: Interactive models accessible without specialized software
- Real-time revision syncing: Immediate updates visible to all team members
- Integrated communication: Comments, markup, and discussion threads linked to spatial features
- Version control: Automatic tracking of changes with rollback capabilities
Mobile field applications transform data collection by enabling surveyors to access GIS databases on tablets and smartphones during site visits. Field crews view existing utility locations, zoning boundaries, and environmental constraints while conducting measurements, ensuring comprehensive documentation and immediate identification of discrepancies.
This connectivity supports more efficient workflows for property valuations by enabling appraisers to access comparable sales data, zoning information, and market analytics while conducting property inspections. The integration of field observations with centralized databases creates comprehensive records supporting defensible valuation conclusions.
Overcoming Implementation Challenges
Addressing Data Quality and Accuracy Concerns
Data quality represents the most significant challenge in GIS integration. Spatial datasets originate from diverse sources with varying accuracy standards, collection methodologies, and update frequencies. Using data without understanding its limitations can lead to flawed analysis and inappropriate conclusions.
Quality assessment strategies include:
- Metadata review: Examining documentation about data collection methods, accuracy specifications, and currency
- Visual inspection: Overlaying datasets from multiple sources to identify discrepancies
- Ground truthing: Field verification of critical features to confirm database accuracy
- Statistical analysis: Calculating positional accuracy metrics where reference data exists
- Fitness-for-purpose evaluation: Determining whether data accuracy meets application requirements
For applications requiring high precision—such as boundary determination or construction layout—only survey-grade data should inform critical decisions. Lower-accuracy data remains valuable for planning-level analysis, preliminary feasibility assessment, and contextual visualization, provided users understand limitations.
Establishing data governance policies ensures consistent quality standards across projects. These policies define acceptable data sources, required accuracy levels for different applications, validation procedures, and update schedules for maintaining currency.
Managing Technology Costs and Return on Investment
GIS implementation requires investment in software licenses, hardware, training, and data acquisition. For surveying firms evaluating adoption, understanding costs and projecting returns proves essential for business planning.
Cost categories include:
| Cost Type | Considerations |
|---|---|
| Software | Initial licenses, annual maintenance, cloud storage fees |
| Hardware | Workstations, mobile devices, GPS receivers, drone systems |
| Data | Commercial datasets, imagery, subscription services |
| Training | Staff education, certification programs, ongoing skill development |
| Personnel | Time investment during implementation, potential specialist hiring |
Return on investment manifests through multiple channels. Direct benefits include reduced project completion time (40-50% reduction documented[4]), fewer field visits through comprehensive desktop research, and decreased error rates from improved quality control. Indirect benefits include competitive differentiation, expanded service offerings, improved client satisfaction, and better risk management through comprehensive site analysis.
Many firms adopt phased implementation strategies that spread costs over time while generating early returns. Initial investment might focus on basic GIS software and training, with subsequent phases adding advanced capabilities like drone systems and AI-powered analysis as revenue from enhanced services funds expansion.
Building Client Understanding and Adoption
Even when surveying firms develop sophisticated GIS capabilities, realizing value requires clients to understand and utilize enhanced deliverables. Traditional survey documents—paper plans with measurements and annotations—remain familiar to most property owners and developers. Interactive GIS visualizations and digital twins represent unfamiliar formats that require client education.
Client adoption strategies:
📢 Demonstration projects: Offering GIS-enhanced deliverables for select projects to showcase capabilities
📚 Educational materials: Creating guides explaining how to access and navigate GIS platforms
🎯 Targeted communication: Emphasizing specific benefits relevant to individual client needs
👥 Training sessions: Providing hands-on instruction for clients managing ongoing projects
💡 Simplified interfaces: Designing user-friendly viewers that don't require GIS expertise
For project management applications, demonstrating how GIS integration enables better coordination, reduces conflicts, and accelerates decision-making helps clients appreciate value beyond traditional deliverables. Case studies showing measurable benefits—cost savings, timeline reductions, risk mitigation—provide compelling evidence supporting adoption.
Some clients may prefer traditional deliverables supplemented with GIS capabilities rather than complete replacement. Hybrid approaches offering both conventional survey plans and interactive GIS access accommodate varying comfort levels with technology while introducing enhanced capabilities.
Future Trends and Industry Evolution
Integration with Building Information Modeling (BIM)
The convergence of GIS and Building Information Modeling (BIM) represents a major trend shaping the surveying profession's future. While GIS excels at large-scale spatial analysis and contextual information, BIM provides detailed 3D models of individual structures with comprehensive component information. Integrating these technologies creates seamless workflows from site analysis through design, construction, and facility management[1].
GIS-BIM integration enables:
- Site context modeling: Placing detailed building models within accurate geographic and regulatory contexts
- Infrastructure coordination: Ensuring building designs accommodate existing utilities and site constraints
- Construction planning: Optimizing equipment access, material staging, and temporary facilities based on site conditions
- Lifecycle management: Linking facility management systems to broader geographic databases for asset tracking
Land surveyors increasingly collaborate with architects, engineers, and construction professionals to provide geospatial data that populates BIM models. This collaboration requires understanding BIM data structures and coordinate systems to ensure compatibility between surveying deliverables and design platforms.
Expansion into Autonomous Systems and Smart Cities
The collaboration between surveying and GIS technology continues expanding into emerging applications including autonomous vehicles, smart cities, and augmented reality[3]. These applications require high-precision spatial data at unprecedented scales and update frequencies.
Autonomous vehicle applications demand centimeter-accurate maps showing lane boundaries, traffic control devices, and road geometry. Surveyors contribute to creating and maintaining these maps through mobile LiDAR scanning and precise positioning systems. As autonomous transportation expands, demand for surveying services supporting this infrastructure will grow substantially.
Smart city initiatives rely on comprehensive spatial databases integrating real-time sensor networks, infrastructure asset inventories, and service delivery systems. Surveyors provide foundational spatial frameworks ensuring accurate positioning of sensors, consistent coordinate systems across municipal systems, and quality-controlled base mapping supporting analysis.
Augmented reality (AR) applications overlay digital information onto physical environments viewed through mobile devices or specialized glasses. Utility companies use AR to visualize underground infrastructure during excavation. Property developers use AR to show proposed buildings in context. These applications require precise alignment between digital models and physical locations—a surveying function.
Sustainability and Climate Adaptation Planning
Environmental challenges including climate change, resource scarcity, and habitat loss increasingly influence property development and land management decisions. GIS Integration for Smarter Property Surveys: Overlaying Data for Better Decision-Making provides essential tools for analyzing environmental risks and planning adaptive strategies.
Climate adaptation applications include:
🌊 Sea level rise modeling: Analyzing elevation data to identify properties vulnerable to coastal flooding
🔥 Wildfire risk assessment: Combining vegetation, topography, and climate data to map fire hazard zones
💨 Storm resilience planning: Modeling wind exposure and flood risk for infrastructure design
🌡️ Heat island mitigation: Analyzing urban form and vegetation to identify areas requiring cooling strategies
Sustainability planning uses GIS to optimize renewable energy installations, plan green infrastructure networks, and assess ecosystem service values. Agricultural applications analyze soil carbon sequestration potential and model sustainable intensification scenarios.
As regulatory frameworks increasingly require climate risk disclosure and adaptation planning, surveying firms offering GIS-based environmental analysis will provide essential services for property transactions, development approvals, and long-term asset management.
Conclusion
GIS Integration for Smarter Property Surveys: Overlaying Data for Better Decision-Making represents far more than technological advancement—it fundamentally transforms how professionals understand, analyze, and communicate spatial information about properties and land. By consolidating zoning regulations, utility infrastructure, environmental constraints, and property boundaries into interactive visual platforms, GIS integration delivers insights impossible through traditional surveying methods alone.
The benefits extend across the property lifecycle from initial feasibility assessment through design, construction, and long-term management. Infrastructure planners optimize corridor alignments and minimize conflicts through comprehensive overlay analysis. Agricultural operators enhance productivity and environmental stewardship through precision management informed by spatial data. Urban planners make evidence-based decisions about growth, services, and sustainability by synthesizing diverse datasets into coherent spatial intelligence.
Implementation follows a structured path from data collection and software selection through layer configuration, team training, and deployment. While challenges exist—including data quality management, cost considerations, and client education—the documented efficiency gains of 40-50% timeline reduction[4] and expanding service capabilities provide compelling business cases for adoption.
As technology continues evolving through AI integration, digital twins, multi-sensor remote sensing, and cloud collaboration, the gap between firms embracing GIS integration and those relying on traditional methods will widen. Early adopters position themselves to capitalize on emerging opportunities in autonomous systems, smart cities, climate adaptation, and BIM integration.
Actionable Next Steps
For surveying professionals ready to embrace GIS integration:
- Assess current capabilities: Inventory existing data, software, and skills to identify gaps
- Define objectives: Determine which applications—infrastructure, agriculture, urban planning—align with business strategy
- Start small: Begin with pilot projects testing workflows before full implementation
- Invest in training: Develop team capabilities through formal education and hands-on practice
- Build data partnerships: Establish relationships with government agencies and data providers
- Educate clients: Demonstrate value through case studies and interactive demonstrations
- Plan for evolution: Stay informed about emerging technologies and plan incremental capability expansion
The future of property surveying lies in spatial intelligence—transforming measurements into insights, data into decisions, and information into competitive advantage. GIS integration provides the foundation for this transformation, enabling surveyors to deliver unprecedented value in an increasingly complex and data-rich environment.
Whether conducting comprehensive building surveys, supporting property development projects, or managing agricultural land, professionals who master GIS integration position themselves at the forefront of their profession—equipped to address today's challenges while preparing for tomorrow's opportunities.
References
[1] Future Land Surveying 2026 – https://haller-blanchard.com/future-land-surveying-2026/
[2] The Future Of Land Surveying Technology And Upcoming Trends In 2026 – https://metricop.com/blogs/land-surveying/the-future-of-land-surveying-technology-and-upcoming-trends-in-2026
[3] How Land Surveying And Gis Collaborate – https://nexgensurveying.com/blog/how-land-surveying-and-gis-collaborate/
[4] Gis Integration For Surveyors Overlaying Data For Smarter Land Management Decisions – https://nottinghillsurveyors.com/blog/gis-integration-for-surveyors-overlaying-data-for-smarter-land-management-decisions
[5] Property Data Pulse – https://giswebtech.com/property-data-pulse
[6] Us Dot Gis Strategic Plan 2026 30 – https://www.transportation.gov/sites/dot.gov/files/2025-12/US-DOT-GIS-Strategic-Plan-2026-30.pdf
[7] Carlson Gis – https://carlsonps.com/products/carlson-gis